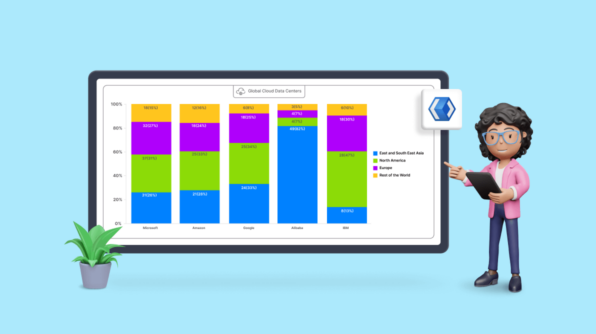
Chart of the Week: Creating a WinUI 100% Stacked Column Chart for Global Distribution of Cloud Provider Data Centers Saiyath Ali Fathima M August 4, 2023
Designing Systems in the Age of AI feat. Hassan Rezk Habib [Webinar Show Notes] Carter Harris July 10, 2023
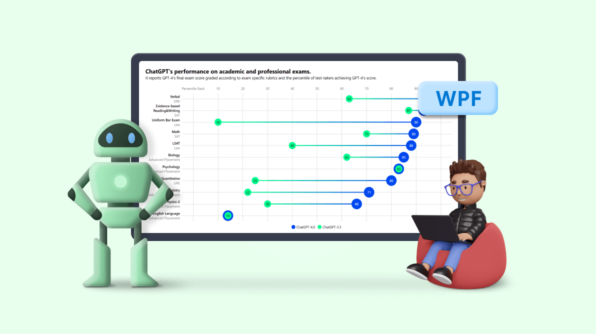
Chart of the Week: Creating a WPF Range Column Chart to Visualize ChatGPT’s Performance in Competitive Exams Moneeshram Dhanabal July 6, 2023
Introducing Syncfusion Notification Support for Visual Studio Jose Seeron Anthony Pitchai July 4, 2023
Syncfusion’s Bold BI Named in the 2023 Gartner® Market Guide for Embedded Analytics Jacqueline Bieringer June 30, 2023


![Designing Systems in the Age of AI feat. Hassan Rezk Habib [Webinar Show Notes]](https://www.syncfusion.com/blogs/wp-content/uploads/2023/07/Designing-Systems-in-the-Age-of-AI-feat.-Hassan-Rezk-Habib-Webinar-Show-Notes-thegem-blog-justified.png)