
Xamarin.Forms Charts and Graphs
- Visualize and analyze data with an ever-expanding collection of 30+ charts and graphs ranging from line to financial charts.
- Easily create and customize charts with shared and intuitive APIs for iOS, Android, UWP, WPF, and macOS.
- Interact with and explore charts with features such as zoom and pan, selection, tooltip, trackball, data labels, and markers.
Trusted by the world’s leading companies

Overview
Xamarin Charts, an easy-to-use, cross-platform charting package, is used to add beautiful charts to mobile and desktop apps. It contains a rich gallery of 30+ charts and graphs, ranging from line to financial charts, that cater to all charting scenarios. Its high performance helps render a large amount of data quickly in your mobile and desktop devices. It also comes with a lot of features such as zooming, panning, tooltip, trackball, drill-down, and events to make the charts more interactive.
High performance
The Xamarin.Forms Chart control includes several data rendering optimizations. It provides the best possible fast paced performance when plotting large volumes of data and handling high-frequency real-time data.

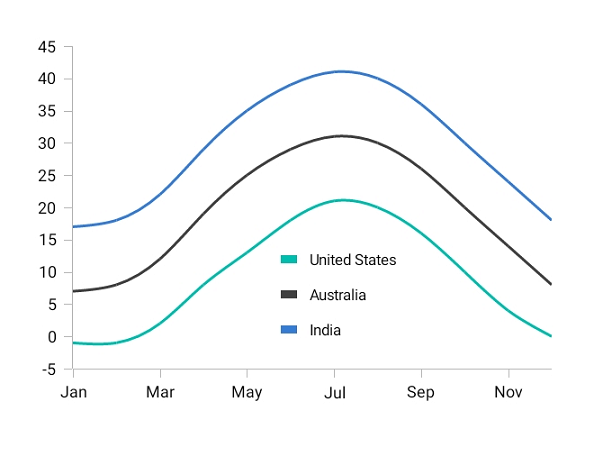
Chart types
The Xamarin.Forms Charts control includes functionality for plotting more than 30 chart types. Each chart type is easily configured with built-in support for creating stunning visual effects.

Chart axis
The Xamarin.Forms Chart with rich UI supports four different types of axes: numerical, categorical, date-time, and logarithmic. The appearance of all chart axis elements can be customized with built-in properties.

User interactions
The end-user experience is greatly enhanced by a set of user interaction features: zooming, panning, trackball, selection, and tooltip.

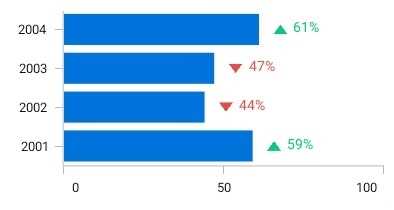
Data labels and markers
Data points can be easily annotated with labels to improve the readability of data in Xamarin.Forms Charts. Readability can be further enhanced by adding markers or customizable symbols.

Data point markers
Mark the data points with built-in available shapes.
Labels and connector lines
Connect a data point and its label with a Bezier curve or a straight line.
Labels customization
Customize the data labels using data templates.
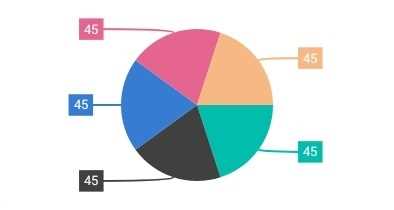
Legends
Legends provide additional information helpful in identifying individual data or series in a Xamarin.Forms chart.

Templating
Apply a data template to a legend item. This helps show more information about a series or data point in a legend.
Positioning
Position the legend anywhere in the chart area to best fit the page.
![]()
Icon customization
Customize legend icons to improve readability with built-in available shapes: rectangles, circles, diamonds, pentagons, triangles, crosses, and straight lines.

Wrap the legend items
Display the legend items in multiple rows when several series are loaded in a single chart.
Annotations
Annotations display metadata about a Xamarin.Forms chart or series at a specific point of interest in the plotting area. Multiple annotations can be added to a single Xamarin.Forms chart.

View annotation
Annotate Xamarin.Forms Chart component with any custom view to provide additional details about a data point. This is generally used for displaying images over a data point.
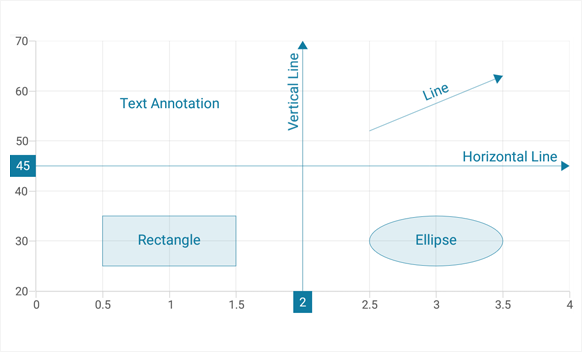
Shape annotation
In addition to the view annotation, all the basic annotation elements like lines, rectangles, ellipses, text, and arrows are available.
Gradient
Apply gradient colors to visualize data in different colors, improving the readability and appearance of charts.

Empty points
Elegantly handle the empty point values in charts.

Range highlighter
Highlight the specific regions in the chart area using strip lines. Also, add text to describe the highlighted area.

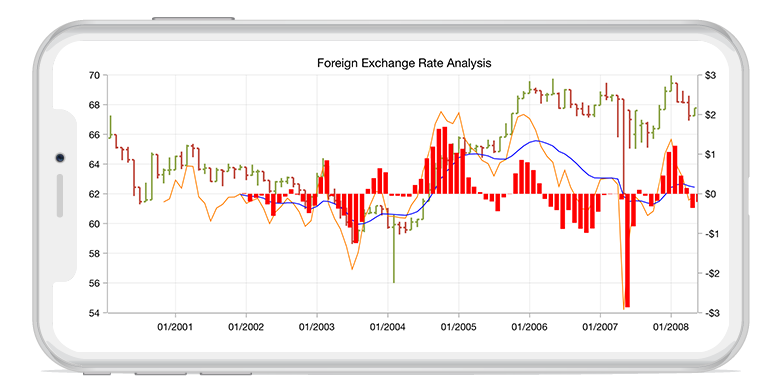
Technical indicators
The Xamarin.Forms Charts control features built-in support for RSI, momentum, Bollinger bands, accumulation distribution, EMA, SMA, stochastic, ATR, MACD, and TMA indicators.
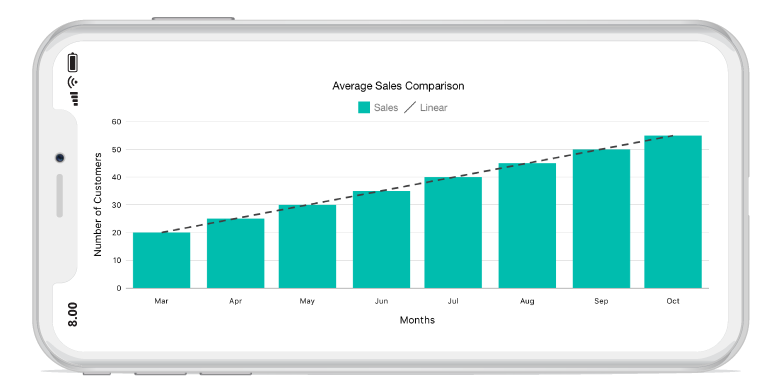
Trendlines
Charts has built-in support for rendering linear, exponential, logarithmic, power, and polynomial trendlines.
Autoscrolling
The autoscrolling feature allows users to focus on a minimal set of data points by visualizing only a few items in the UI and viewing the remaining data points by scrolling. Configure this feature for real-time updates to view recently added data points.

Vertical charts
Rotate all the series types to plot data in a vertical direction and view the data from a different perspective.

Exporting
Export charts as images to a picture gallery or convert the charts to a memory stream.

Localization
Localize all the static text within the charts to any desired language.

Xamarin.Forms Charts Code Example
Easily get started with the Xamarin.Forms charts using a few simple lines of C# code example as demonstrated below. Also explore our Xamarin.Forms Charts Example that shows you how to render and configure the Charts for Xamarin.Forms.
<ContentPage xmlns="http://xamarin.com/schemas/2014/forms"
             xmlns:x="http://schemas.microsoft.com/winfx/2009/xaml"
             xmlns:local="clr-namespace:ChartExample"
             xmlns:chart="clr-namespace:Syncfusion.SfChart.XForms;assembly=Syncfusion.SfChart.XForms"
             x:Class="ChartExample.MainPage">

    <ContentPage.BindingContext>
        <local:ViewModel/>
    </ContentPage.BindingContext>

	<chart:SfChart>

		<chart:SfChart.PrimaryAxis>

			<chart:CategoryAxis>

			</chart:CategoryAxis>

		</chart:SfChart.PrimaryAxis>

		<chart:SfChart.SecondaryAxis>

			<chart:NumericalAxis>

			</chart:NumericalAxis>

		</chart:SfChart.SecondaryAxis>

		<chart:ColumnSeries ItemsSource="{Binding Data}" XBindingPath="Month" YBindingPath="Target"/>

	</chart:SfChart>

</ContentPage>
public class Model
{
public string Month { get; set; }
public double Target { get; set; }
public Model(string xValue, double yValue)
{
Month = xValue;
Target = yValue;
}
}
public class ViewModel
{
public ObservableCollection<Model> Data { get; set; }
public ViewModel()
{
Data = new ObservableCollection<Model>()
{
new Model("Jan", 50),
new Model("Feb", 70),
new Model("Mar", 65),
new Model("Apr", 57),
new Model("May", 48),
};
}
}Not sure how to create your first Xamarin.Forms chart? Our tutorial videos and documentation can help.
I’d love to watch now I’d love to read now150+ XAMARIN UI CONTROLS
ALL CONTROLS
-
Xamarin.Forms
-
Xamarin.Android
-
Xamarin.iOS
-
GRIDSDATA VISUALIZATIONNAVIGATIONEDITORSLAYOUTPROJECT MANAGEMENTNOTIFICATIONDOCUMENT PROCESSING LIBRARIESVIEWER/EDITORMISCELLANEOUSCHAT
-
GRIDSDATA VISUALIZATIONNAVIGATIONEDITORSLAYOUTPROJECT MANAGEMENTNOTIFICATIONVIEWER/EDITORDOCUMENT PROCESSING LIBRARIESMISCELLANEOUS
-
GRIDSDATA VISUALIZATIONNAVIGATIONEDITORSLAYOUTPROJECT MANAGEMENTNOTIFICATIONVIEWER/EDITORDOCUMENT PROCESSING LIBRARIESMISCELLANEOUS
The most downloaded control (based on the nuget.org download count).
Frequently Asked Questions
Why should you choose Syncfusion Xamarin Charts?
Use for 30+ chart types and elegant animation.
Enhance end-user experience with a set of great user interaction features.
- Easily create and customize charts with shared and intuitive APIs for iOS, Android, UWP, WPF, and macOS.
- One of the best Xamarin Charts in the market that offers feature-rich UI to interact with the software.
- Visualize large quantities of data, flexible data binding, and user customization.
- Work with a simple configuration and API.
- Use a lightweight and truly native control.
Access expansive learning resources such as demos, documentation and videos to learn and get started quickly with Xamarin Charts.
Where can I find the Syncfusion Xamarin Charts demo?
You can find our Xamarin Charts demo here
Can I download and utilize the Syncfusion Xamarin Charts for free?
No, this is a commercial product and requires a paid license. However, a free community license is also available for companies and individuals whose organizations have less than $1 million USD in annual gross revenue, 5 or fewer developers, and 10 or fewer total employees.
How do I get started with Syncfusion Xamarin Charts?
A good place to start would be our comprehensive getting started documentation.
Our Customers Love Us
Having an excellent set of tools and a great support team, Syncfusion® reduces customers’ development time.Here are some of their experiences.

Everything works perfect, examples are great and support team tries to do their best to help
Support and amount of tutorials. They help a lot to understand the basics, of what syncfusion can suggest. I use data grids, charts. It has a good design too. It’s very good.

Arnoldas A,

Junior Node.JS Developer
Best Mobile Chart Solution for Flutter - most professional and responsive engineering and support
Syncfusion Team is World Class! - We discovered a problem implementing the Syncfusion Charts, Submitted a support ticket - immediate response & help. The Engineers confirmed the problem - and immediately started creating a new version that fixed the problem, they kept in contact with me - in a few days, the new version was ready and it works flawlessly. If you are looking for a team that will support you and work with your DEV team rapidly and responsively - then Syncfusion is for you. Best charting solution for mobile (we are using the Flutter plug-ins) - works great on the latest IOS & Android Builds - very customizable - great training and support - We highly recommend Syncfusion for the products & equally the customer & dev support. Very pleasant to work with as well ;-)

Don M,
Owner/Developer
Rated by users across the globe
Syncfusion Xamarin.Forms Resources
Learning
 Documentation
 Documentation


Awards
Greatness—it’s one thing to say you have it, but it means more when others recognize it. Syncfusion® is proud to hold the following industry awards.

