.NET MAUI Maps - Interactive and Powerful Maps Control
- Utilize imagery support from OpenStreetMap, Bing Maps, Google Maps, and other tile providers.
- Render GeoJSON or shapefile data as rich, graphical representations of geographical areas.
- Use markers to precisely denote locations on a map.
Trusted by the world’s leading companies

Overview
The .NET MAUI Maps control is a powerful data visualization component that displays statistical information for a geographical area. Its rich feature set includes tile rendering from OpenStreetMap, Bing Maps, Google Maps, and other tile providers. The shape layer has highly interactive and customizable features such as selection, tooltip, legends, markers, bubbles, and color mapping. Users can generate maps to determine population density, sales distribution, political boundaries, weather, elections, and routes.
.NET MAUI Maps Code Example
Easily get started with the .NET MAUI Maps control using a few simple lines of XAML code example as demonstrated below. Also, explore our .NET MAUI Maps Example that shows you how to render and configure the .NET MAUI Maps.
<?xml version="1.0" encoding="utf-8" ?>
<ContentPage xmlns="http://schemas.microsoft.com/dotnet/2021/maui"
xmlns:x="http://schemas.microsoft.com/winfx/2009/xaml"
x:Class="SimpleSample.MainPage"
xmlns:local="clr-namespace:SimpleSample"
xmlns:map="clr-namespace:Syncfusion.Maui.Maps;assembly=Syncfusion.Maui.Maps">
<map:SfMaps>
<map:SfMaps.Layer>
<map:MapShapeLayer ShapesSource="https://cdn.syncfusion.com/maps/map-data/world-map.json"
ShapeStroke="DarkGrey">
</map:MapShapeLayer>
</map:SfMaps.Layer>
</map:SfMaps>
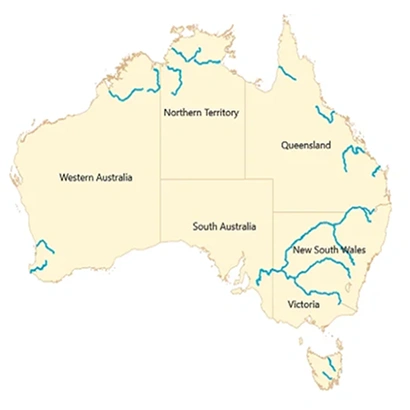
</ContentPage>Shape layer
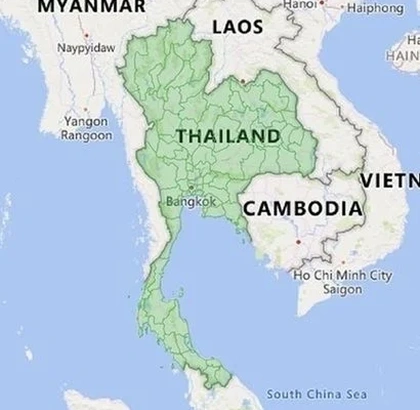
Render GeoJSON or shapefile data as custom maps or geographical area shapes on a shape layer for powerful data visualization. Customize the maps to the desired look using built-in options.
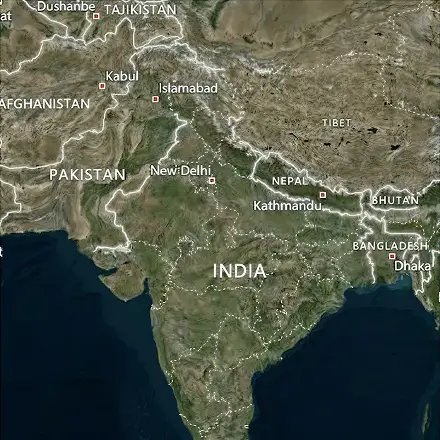
Tile layer
An interactive tile layer allows you to load and customize map tiles from web map-tile services such as OpenStreetMaps, Bing Maps API, Google Maps Tile API, TomTom, Mapbox, and Esri’s ArcGIS. Use markers to denote a specific latitude and longitude in the tile layer. Zoom and pan the tile layer to navigate across the regions and take a closer look.
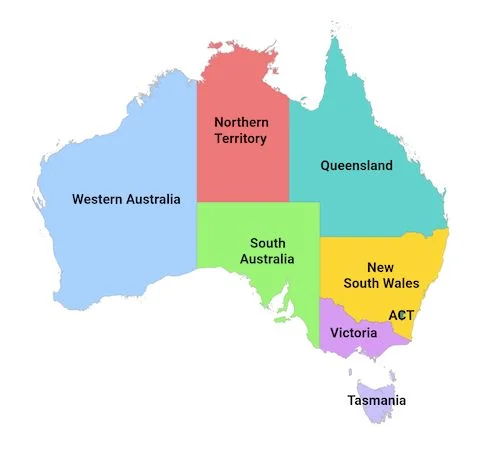
Data labels
Data labels in a shape layer provide basic information about shapes by displaying their names and such. If required, trim or hide the labels when they exceed the shape bounds.
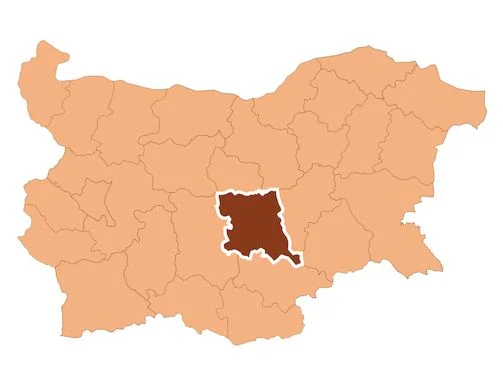
Selection
Highlight a shape to focus attention on a specific area. Use this functionality to navigate pages and show detailed information about a selected area.
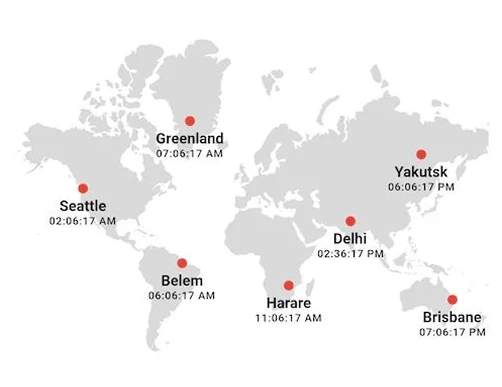
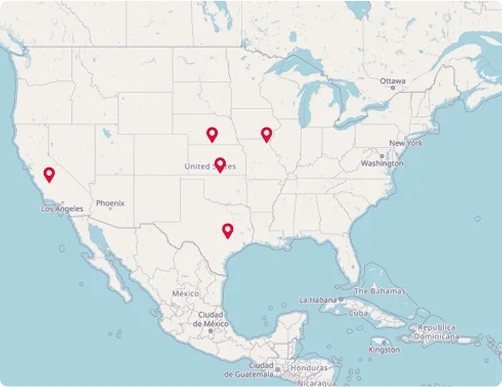
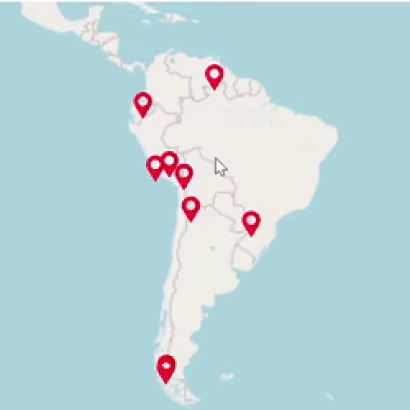
Interactive map markers
Show markers for a shape layer with specific latitudes and longitudes. Use multiple markers to denote important locations in the .NET MAUI Maps control. Use built-in marker icons such as circles, diamonds, rectangles, and triangles. As a custom marker, you can use any type of content, like a label control for displaying simple text. Change the marker position dynamically to the desired location in scenarios like real-time location updates. Use a marker’s tap or click interaction for custom functionalities such as navigation or a custom info window.
Shape layer
Show markers for a shape layer with specific latitudes and longitudes.
Tile layer
Show markers for a tile layer with specific latitudes and longitudes.
Legends
Legends in the shape layer provide clear information about the data in the .NET MAUI Maps control by explaining the meaning of the shapes and bubble colors on the maps.
Shape legends
Shape legends effectively present distinct details for any data depicted in the .NET MAUI Maps control through the use of shapes.
Bubble legends
The bubble legends present precise information regarding the data represented using bubbles.
Position
Move a legend to any of the four sides (top, left, bottom, and right) on a map.
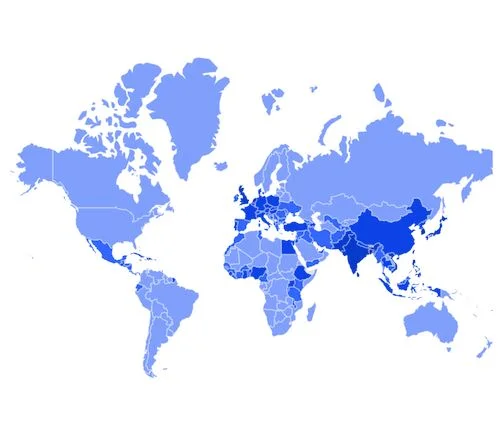
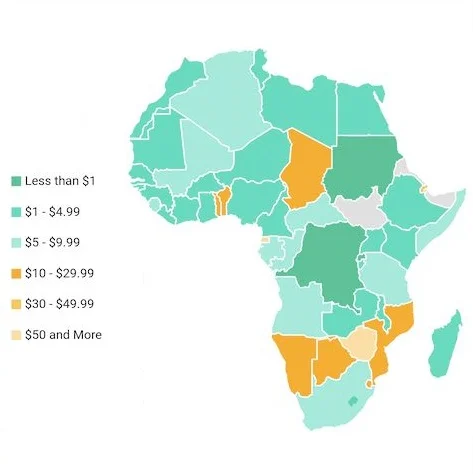
Color mapping
Categorize the shapes on a map by customizing their color based on their underlying data. The .NET MAUI Maps control supports two types of color mapping: equal and range.
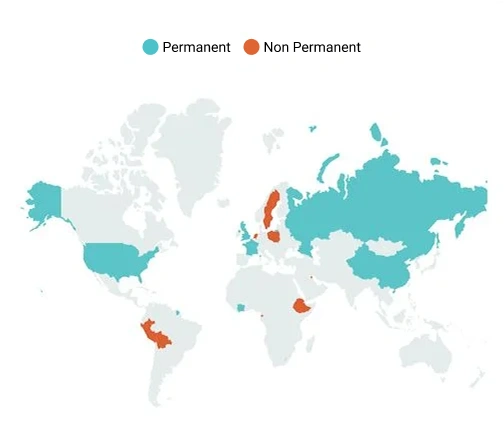
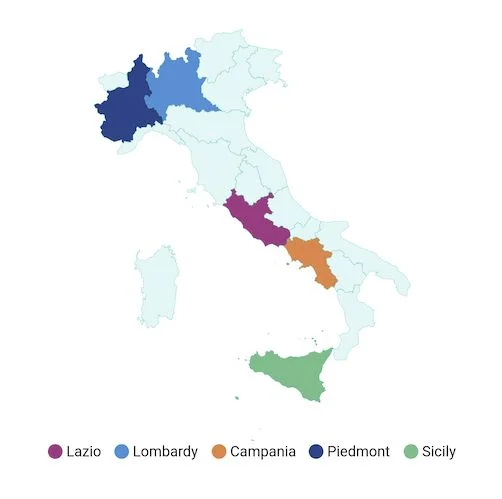
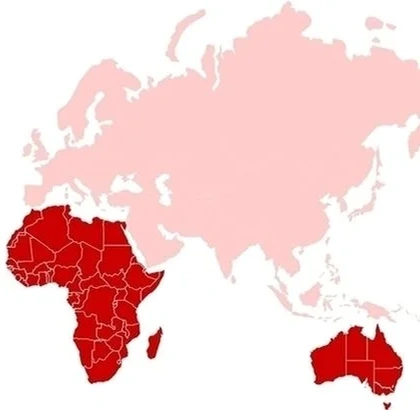
Equal color mapping
Apply a specific color to a shape purely based on its data. For example, apply colors to countries based on their organization membership.
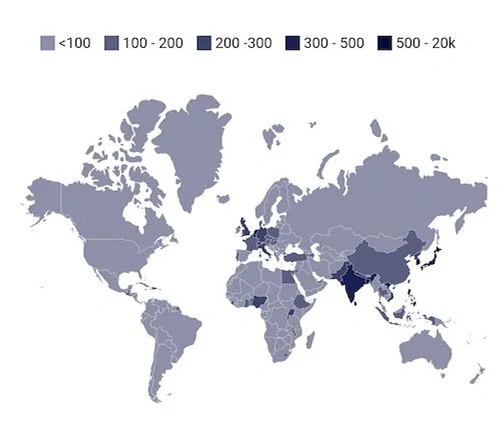
Range color mapping
Apply colors to shapes if their data falls within a specific range. For example, apply colors to countries based on their population density.
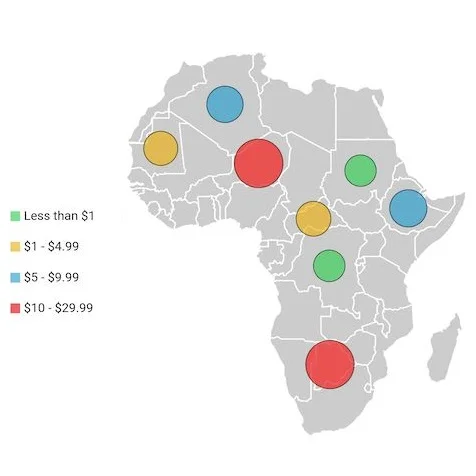
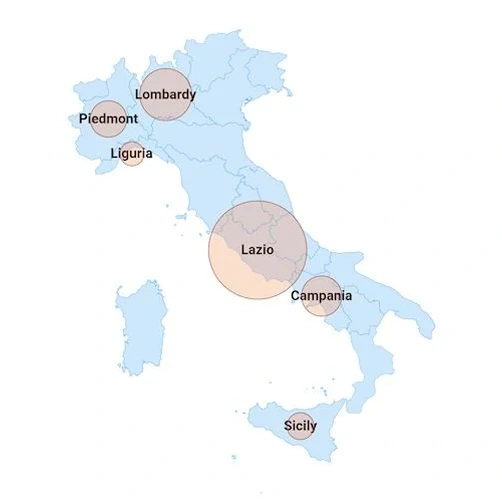
Map bubbles
Add information to shapes, such as population density and number of users. Bubbles can be rendered in different colors and sizes based on the settings of their assigned shape.
Color customization
Customize the color of a map bubble and its transparency based on data.
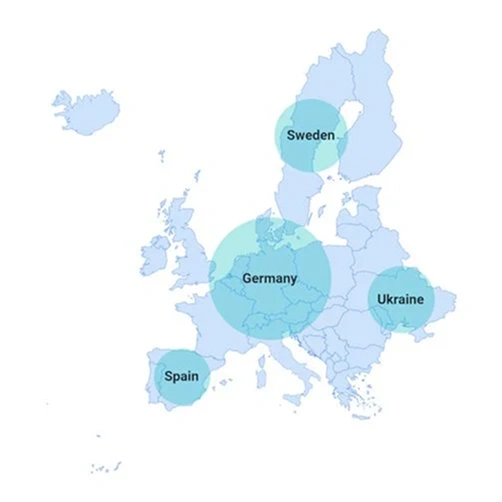
Size customization
Customize the size of a bubble based on data to improve the readability of the map.
Tooltips
Enhance the user experience by adding tooltips that display additional information about shapes, bubbles, and markers when they are tapped, clicked, or hovered over.
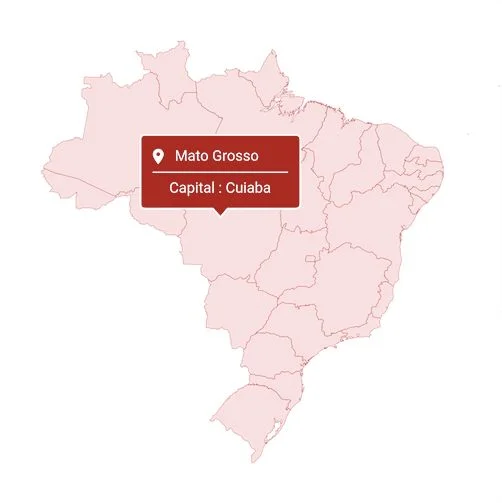
Shape tooltips
A shape tooltip displays information when interacting with shapes.
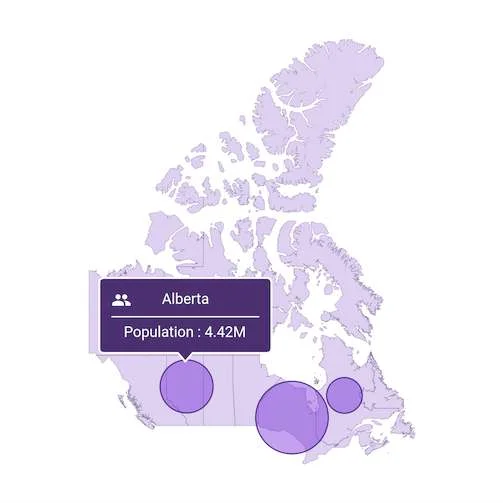
Bubble tooltips
A bubble tooltip displays more information whenever you engage with the bubbles.
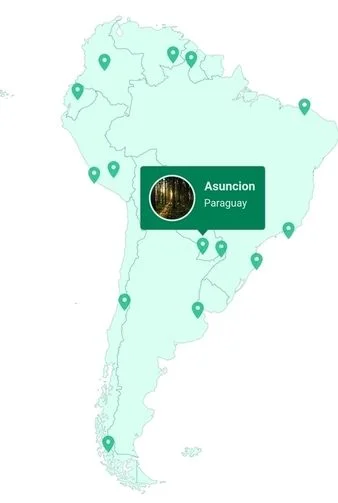
Marker tooltips
Show tooltips for markers every time you engage with them in .NET MAUI Maps.
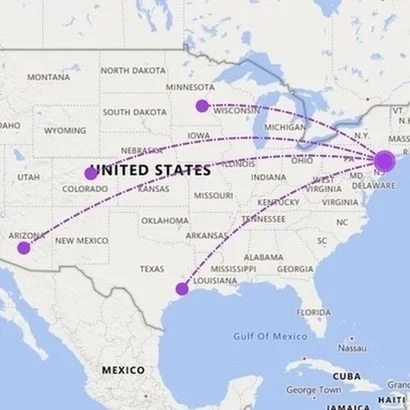
Show routes and highlight regions
Add vector shapes such as lines, polylines, arcs, circles, and polygons on both the shape layer and tile layer to show routes and highlight specific regions.
On shape layer
Add vector shapes on top of the shape layer to show routes and highlight specific regions.
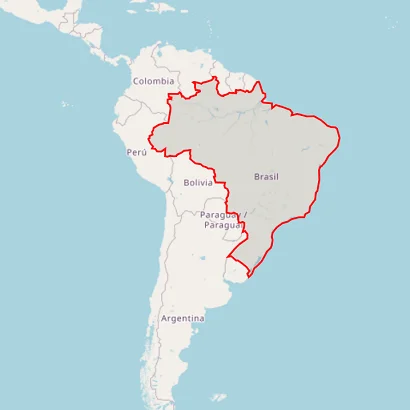
On tile layer
Add vector shapes on top of the tile layer to show routes and highlight specific regions.
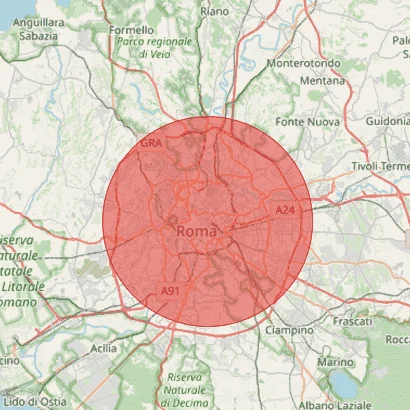
Circles
Add circles on the shape layer and tile layer. Every Maps circle renders a circle using a center and radius.
Polygons
Add polygons on the shape layer and tile layer. Every polygon connects multiple coordinates through a points property.
Shape sublayers
Integrate a shape sublayer with GeoJSON data within an existing shape layer or tile layer to provide more detailed information about a specific region.
On shape layer
A shape layer can contain a collection of map sublayers, where you can add a shape layer as a sublayer of another shape layer.
On tile layer
A tile layer can contain a collection of map sublayers, where you can add a shape layer as a sublayer of the tile layer.
Zooming and panning
Zoom in any layer for a closer look at a specific region by pinching the screen, scrolling the mouse wheel, or using the keyboard track pad. Pan the map to navigate across regions. Zooming and panning can be enabled for both the shape layer and the tile layer.
Not sure how to create your first .NET MAUI Maps control? Our tutorial videos and documentation can help.
I’d love to watch it now I’d love to read it now.NET MAUI DataViz & UI Controls
Standalone UI SDKs
Integrate the DataGrid, Chart, Scheduler, and Rich Text Editor UI components into applications to enable rich interaction and visualization, delivering a seamless user experience.
Document Solutions
Integrate the PDF Viewer, DOCX Editor, Spreadsheet Editor, and document-processing libraries into the .NET MAUI applications to enable a smooth user experience.
Frequently Asked Questions
Why should you choose the Syncfusion .NET MAUI Maps control?
The Syncfusion .NET MAUI Maps control lets users:
Display map areas using GeoJSON or shapefile data.
Highlight locations with built-in symbols or custom content at specific latitudes and longitudes on the map.
Enhance shapes with bubbles, conveying data such as population density or user numbers, presented in various colors and sizes based on data values.
Highlight a region by selecting a shape on the map and choose to trigger actions during shape selection.
Utilize legends to offer clear information on data plotted in the map, improving understanding and interpretation.
- Categorize map shapes based on underlying values by assigning colors for specific values or ranges.
Display additional information through a customizable tooltip, enhancing users’ understanding of the map data.
- One of the best .NET MAUI Maps in the market, offering feature-rich UI to interact with the software.
Simple configuration and APIs.
- Mobile-touch friendly.
Extensive demos, documentation, and videos to let you get started quickly with the .NET MAUI Maps.
Where can I find the Syncfusion .NET MAUI Maps demo?
You can find our .NET MAUI Maps demo here, which demonstrates how to render and configure the Maps control.
What is .NET MAUI Maps?
.NET MAUI Maps is a UI control for visualizing geographical data, supporting shape and tile layers and many customization options.
How can I add markers to .NET MAUI Maps?
Markers can be added to indicate specific locations using latitude and longitude properties in either shape or tile layers.
How do I create a world map in .NET MAUI Maps?
You can display world map boundaries in .NET MAUI Maps by using the shape layer with a GeoJSON file or SHP of world map boundaries. You can also use the tile layer with the corresponding map provider added.
ShapesSource="https://cdn.syncfusion.com/maps/map-data/world-map.json"> ShapesSource="https://cdn.syncfusion.com/maps/map-data/africa.json" /> Can I download and utilize the Syncfusion .NET MAUI Maps control for free?
No, this is a commercial product and requires a paid license. However, a free community license is also available for companies and individuals whose organizations have less than $1 million USD in annual gross revenue, 5 or fewer developers, and 10 or fewer total employees.
How do I get started with Syncfusion .NET MAUI Maps?
A good place to start would be our comprehensive getting started documentation.
How do I display maps in .NET MAUI using GeoJSON files?
You can render GeoJSON data in .NET MAUI by specifying the GeoJSON file path to display the map.
How do I implement offline maps in .NET MAUI?
Offline maps can be implemented by caching tile images or using local GeoJSON files in the shape layer.
How do I add a heatmap in .NET MAUI Maps?
Heatmaps are not natively supported but can be simulated by customizing shape colors dynamically based on data intensity.
Our Customers Love Us


See Real Success Stories
Developers around the world trust Syncfusion’s Essential Studio to simplify complex projects and speed up delivery. With a vast library of UI controls, powerful SDKs, and reliable support, Essential Studio helps teams build enterprise-ready applications with confidence.
Read Our Customer StoriesIndustry
Software development
75% Cost reduction
50% Faster development
Industry
Utilities (oil and gas)
450+ hours saved
Streamlined processes and hours of development effort saved.
Advanced, flexible features
Empowered users through robust and versatile functionality.
Industry
Software and technology
1000+ of hours saved
Accelerated development with enterprise-ready UI components.
Efficient file management
Streamlined workflows with document libraries without building them from scratch.
Industry
Software and technology
2 Years of delay avoided
Two years of delays prevented with proactive planning.
On-time delivery
Projects delivered on schedule using trusted controls.
Industry
IT services and IT consulting
Improved performance
Large datasets handled with easy customization and quick debugging.
Highly customizable
Plug-and-play controls with quick template integration.
Industry
Professional services
Instant access
Quick availability of features and resources.
Reduced dependencies
Fewer dependencies for faster development.
Rated by users across the globe


 .NET MAUI UI Kit
Awards
Greatness—it’s one thing to say you have it, but it means more when others recognize it. Syncfusion® is proud to hold the following industry awards.

