WinForms Pivot Grid (Pivot Table) Control
- Pivot table field list (UI) for changing pivot reports at runtime.
- Aggregate, filter, sort, summarize, and group pivot data.
- Seamless editing and asynchronous loading of pivot data.
.NET 10 support now available
Trusted by the world’s leading companies

Overview
The WinForms pivot grid control organizes and summarizes business data and displays the result in a cross-table format.
High performance

Asynchronous loading
Users can perform long-running operations asynchronously on a background thread, and access other UI controls without distraction.

On-demand loading
This control provides an great loading performance for large set of records. This feature helps load data in the pivot grid on-demand using the Index Engine.
Data binding
The WinForms Pivot Grid control simulates the pivot table feature of Excel. The data source for the control should be a DataTable, DataView, DataSet from SQL databases or collections like IEnumerable, ICollection, IList, List, and ArrayList.
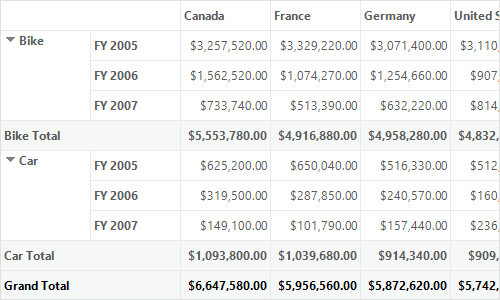

Chart data binding
The data from the WinForms pivot grid columns and rows can be plotted in a chart (graphical format), providing good visualization.
Pivot table field list and group fields
The pivot table field list and group fields are automatically populated with fields from the bound data source. They allow users to drag fields, filter and sort them, and create pivot reports at runtime.


Drill down and drill up
Drill down (expand) and drill up (collapse) to visualize the pivot grid information in both abstract and detailed views.
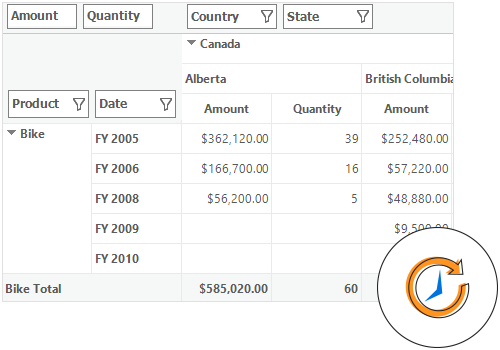
Defer update
Users can refresh the control only on demand and not during every UI interaction.

Editing and updating

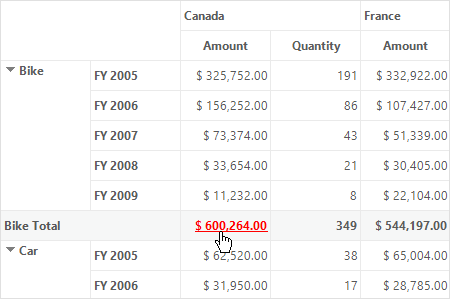
Editing
Edit values at runtime, thereby updating the total cell simultaneously.
Updating
Update values in real time by pushing the live data and refreshing the control whenever required.

Filtering
Filtering is retrieving values from the collection based on a specific condition.

Header sorting
Sort the column and row header text either in the ascending or descending order.

Custom sorting
Orders the column and row header text based on the custom comparer defined by the user.

Column sorting
Sort the column values either in the ascending or descending order. Sort by clicking the desired column header, which is achieved programmatically also.

Multi-column sorting
Multicolumn sorting allows you to sort the fields one after the other. It can be applied for Normal mode and Row Pivots Only mode.
Summaries and calculations

Summaries
Define custom summaries for the pivot item values programmatically. The control also supports 19 built-in summary types for customization.

Calculations
Along with 16 built-in calculation types, there is also support to insert user-defined calculated fields using a custom formula programmatically.
Calculated field
The Pivot Grid supports unbound fields. Unbound fields get data executing a simple user-defined formula.


Expression field
Expression field generates data by executing the user-defined expression. The generated data are specific to few field(s) from the underlying data source.
Drill through
Drill through obtains a list of raw items for a particular value cell or summary cell for users to view.


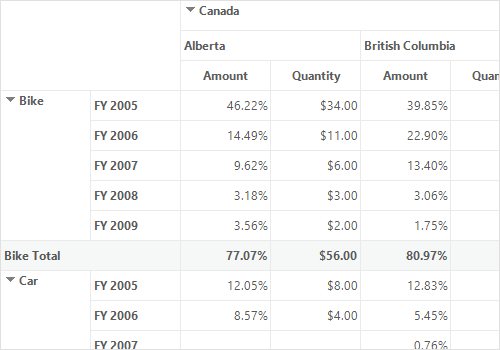
Conditional formatting
Allows users to define conditions that, when met, format values and summary cells font, color, and border settings.
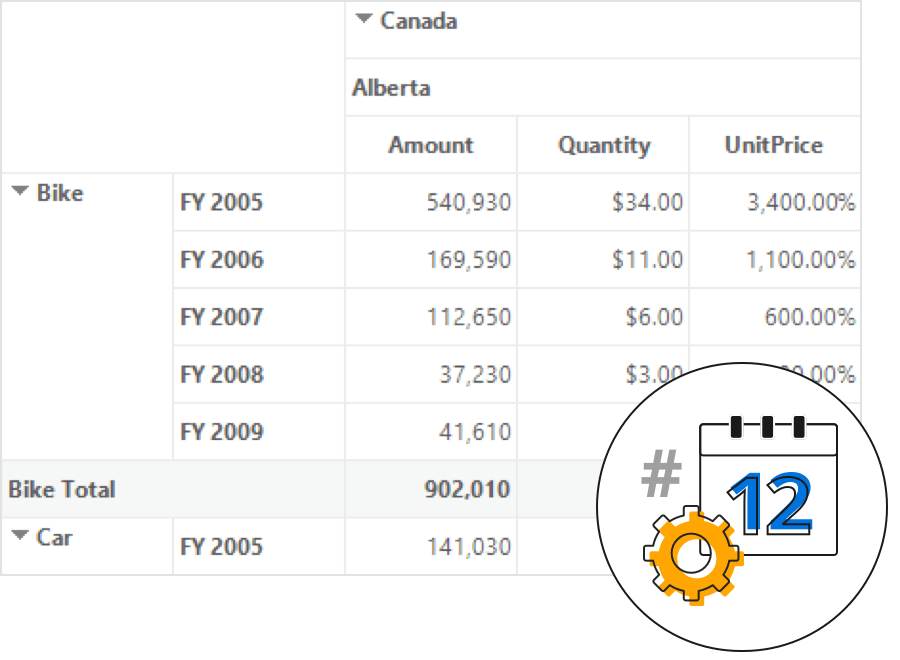
Number formatting and date formatting
Number formatting and date formatting help transform the appearance of an actual cell value.
Visualizations
Users can visualize the control either as a flat grid or a pivot table similar to Excel.
Normal layout
The normal layout allows the pivot grid control to display row field values and column field values with computational field values.

Flat grid
The flat layout also called as “row pivots only mode”, displays only the row field values with computational field values.

Totals
Subtotals and grand totals are calculated automatically by the pivot engine inside the source and displayed in the pivot table. This helps users make decisions based on the totals. Also, users can show or hide subtotals and grand totals for rows and columns.
Column and row
Pivot rows and column are defined by using the PivotItem object which holds the information needed for rows and column that appear in the pivot grid control.
Hyperlink
Retrieve information about a particular cell on hyperlink cell click. Perform custom operations programmatically as well.
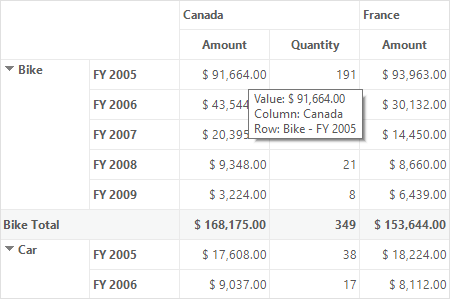
Tooltip
Provides basic information about a cell when hovering the mouse pointer over it.

Freeze header
There is built-in support for freezing row and column headers for a better view of values in a pivot grid.

Selection
Pivot grid supports selection of a particular range of cells/rows/columns/table in a grid.
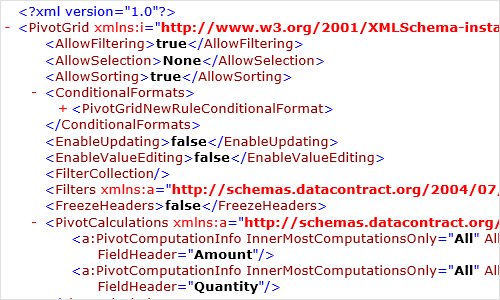
Save and load reports
Settings in the WinForms Pivot Grid control can be serialized to an XML format and saved. Saved reports can be loaded back using the built-in deserialization options.

Exporting and printing
The WinForms Pivot Grid control has a rich set of options available for exporting data to Excel, Word, and PDF, and printing the same. There are options to customize the exporting and printing operations.
Custom style and themes

Built-in themes
The WinForms Pivot Grid is shipped with built-in themes like Office 2007, Office 2010, Office 2016, and Metro.

Custom styling
Customize the appearance of the control programmatically.
Developer friendly API
For a great developer experience, use the flexible built-in APIs to define and customize the WinForms Pivot Grid control. Developers can optimize the data bound to the control and completely customize the user interface (UI) using code easily.
Globalization and localization

Globalization
Allows users from different locales to use the control by applying a date, currency, and number formats to suit local preferences.

Right-to-left (RTL)
Users can display the text direction and layout of the control in the right-to-left (RTL) direction.

Localization
Allows users to customize the text in the user interface based on the local culture.
WinForms Pivot Grid Code Example
Easily get started with the WinForms Pivot Grid using a few simple lines of C# code example as demonstrated below. Also explore our WinForms Pivot Grid Example that shows you how to render and configure the Pivot Grid in WinForms.
using System.Windows.Forms;
using Syncfusion.PivotAnalysis.Base;
using Syncfusion.Windows.Forms.PivotAnalysis;
namespace WindowsFormsApplication1
{
    public partial class Form1 : Form
    {
        public Form1()
        {
            InitializeComponent();
            PivotGridControl pivotGridControl1 = new PivotGridControl();
            pivotGridControl1.Size = new System.Drawing.Size(1496, 860);
            this.Controls.Add(pivotGridControl1);
            // Adding ItemSource to the Control
            pivotGridControl1.ItemSource = ProductSalesCollection.GetSalesData();
            // Adding PivotRows to the Control
            pivotGridControl1.PivotRows.Add(new PivotItem { FieldMappingName = "Product", TotalHeader = "Total" });
            pivotGridControl1.PivotRows.Add(new PivotItem { FieldMappingName = "Date", TotalHeader = "Total" });
            // Adding PivotColumns to the Control
            pivotGridControl1.PivotColumns.Add(new PivotItem { FieldMappingName = "Country", TotalHeader = "Total" });
            pivotGridControl1.PivotColumns.Add(new PivotItem { FieldMappingName = "State", TotalHeader = "Total" });
            // Adding PivotCalculations to the Control
            pivotGridControl1.PivotCalculations.Add(new PivotComputationInfo { FieldName = "Amount", Format = "$ #,##0.00", SummaryType = SummaryType.DoubleTotalSum });
            pivotGridControl1.PivotCalculations.Add(new PivotComputationInfo { FieldName = "Quantity", Format = "#,##0" });
        }
    }
}
using System;
using System.Collections.ObjectModel;
namespace WindowsFormsApplication1
{
/// <summary>
/// Represents a class that contains product sale details.
/// </summary>
public class ProductSaleInfo
{
public string Product { get; set; }
public string Date { get; set; }
public string Country { get; set; }
public string State { get; set; }
public int Quantity { get; set; }
public double Amount { get; set; }
public double UnitPrice { get; set; }
public double TotalPrice { get; set; }
public override string ToString()
{
return string.Format("{0}-{1}-{2}", Country, State, Product);
}
}
}using System;
using System.Collections.ObjectModel;
namespace WindowsFormsApplication1
{
/// <summary>
/// Represents a class that contains the product sale details collection.
/// </summary>
public class ProductSalesCollection
{
public static ObservableCollection<ProductSaleInfo> GetSalesData()
{
// Geography
string[] countries = { "Australia", "Canada", "France", "Germany", "United Kingdom", "United States" };
string[] ausStates = { "New South Wales", "Queensland", "South Australia", "Tasmania", "Victoria" };
string[] canadaStates = { "Alberta", "British Columbia", "Brunswick", "Manitoba", "Ontario", "Quebec" };
string[] franceStates = { "Charente Maritime", "Essonne", "Garonne (Haute)", "Gers" };
string[] germanyStates = { "Bayern", "Brandenburg", "Hamburg", "Hessen", "Nordrhein Westfalen", "Saarland" };
string[] ukStates = { "England" };
string[] ussStates = { "New York", "North Carolina", "Alabama", "California", "Colorado", "New Mexico", "South Carolina" };
// Time
string[] dates = { "FY 2005", "FY 2006", "FY 2007", "FY 2008", "FY 2009" };
// Products
string[] products = { "Bike", "Car" };
Random r = new Random(123345345);
int numberOfRecords = 2000;
ObservableCollection<ProductSaleInfo> listOfProductSales = new ObservableCollection<ProductSaleInfo>();
for (int i = 0; i < numberOfRecords; i++)
{
ProductSaleInfo sales = new ProductSaleInfo();
sales.Country = countries[r.Next(1, countries.GetLength(0))];
sales.Quantity = r.Next(1, 12);
// 1 percent discount for 1 quantity
double discount = (300 * sales.Quantity) * (double.Parse(sales.Quantity.ToString()) / 100);
sales.Amount = (300 * sales.Quantity) - discount;
sales.TotalPrice = sales.Amount * sales.Quantity;
sales.UnitPrice = sales.Amount / sales.Quantity;
sales.Date = dates[r.Next(r.Next(dates.GetLength(0) + 1))];
sales.Product = products[r.Next(r.Next(products.GetLength(0) + 1))];
switch (sales.Country)
{
case "Australia":
{
sales.State = ausStates[r.Next(ausStates.GetLength(0))];
break;
}
case "Canada":
{
sales.State = canadaStates[r.Next(canadaStates.GetLength(0))];
break;
}
case "France":
{
sales.State = franceStates[r.Next(franceStates.GetLength(0))];
break;
}
case "Germany":
{
sales.State = germanyStates[r.Next(germanyStates.GetLength(0))];
break;
}
case "United Kingdom":
{
sales.State = ukStates[r.Next(ukStates.GetLength(0))];
break;
}
case "United States":
{
sales.State = ussStates[r.Next(ussStates.GetLength(0))];
break;
}
}
listOfProductSales.Add(sales);
}
return listOfProductSales;
}
}
}Not sure how to create your first WinForms Pivot Grid? Our documentation can help.
I’d love to read it now120+ WINDOWS FORMS CONTROLS
ALL CONTROLS
CONVERSATIONAL UI
DATA VISUALIZATION
INPUT CONTROLS
NAVIGATION
DIALOGS & NOTIFICATION
LAYOUT
LISTS & DROPDOWN
CALENDAR
MISCELLANEOUS
FILE VIEWERS & EDITORS
BUTTONS
Standalone UI SDKs
Integrate the DataGrid, Chart, Scheduler and Diagram UI components into applications to enable rich interaction and visualization, delivering a seamless user experience.
Document Solutions
Integrate the PDF Viewer, DOCX Editor, Spreadsheet Editor, and document-processing libraries into the WinForms applications to enable a smooth user experience.
Frequently Asked Questions
Why should you choose Syncfusion WinForms Pivot Grid?
- Optimized architecture enables users to load large set of data.
Aggregation (calculation), filtering, sorting, summarizing], and grouping of pivot data.
Seamless editing and asynchronous loading of pivot data.
- Supports to bind different types of relational data sources such as IList, IEnumerable, etc.
- Drill down (expand) and drill up (collapse) to visualize the pivot information in both abstract and detailed views.
Provides a built-in pivot schema designer very similar to Microsoft’s Excel Pivot Table.
- Easily customize the appearance of the elements.
- One of the best WinForms Pivot Grid in the market that offers feature-rich UI to interact with the software.
Extensive demos and documentation to learn quickly and get started with Pivot Grid.
Where can I find the Syncfusion WinForms Pivot Grid demo?
You can find our WinForms Pivot Grid demo on
GitHub location.
Can I download and utilize the Syncfusion WinForms Pivot Grid for free?
No, this is a commercial product and requires a paid license. However, a free community license is also available for companies and individuals whose organizations have less than $1 million USD in annual gross revenue, 5 or fewer developers, and 10 or fewer total employees.
How do I get started with Syncfusion WinForms Pivot Grid?
A good place to start would be our comprehensive getting started documentation.
Our Customers Love Us
Having an excellent set of tools and a great support team, Syncfusion® reduces customers’ development time.Here are some of their experiences.

Excellent experience with Syncfusion!
Syncfusion is a product that makes life easier! I use it to create Blazor applications (server side and webassembly) and the controls speed up development a lot. Furthermore, if needed, it is possible to ask for direct support that is never long in coming!

Andrea Scarpante,

Sydea srl
The complete component set
It is the most complete component set available. Also very handy is the fact that there is a community edition, this gives me the opportunity to test thing at home without buying a separate license.

Johan Visser,

H and T Pawnbrokers
See Real Success Stories
Developers around the world trust Syncfusion’s Essential Studio to simplify complex projects and speed up delivery. With a vast library of UI controls, powerful SDKs, and reliable support, Essential Studio helps teams build enterprise-ready applications with confidence.
Read Our Customer StoriesIndustry
Software development
75% Cost reduction
50% Faster development
Industry
Utilities (oil and gas)
450+ hours saved
Streamlined processes and hours of development effort saved.
Advanced, flexible features
Empowered users through robust and versatile functionality.
Industry
Software and technology
1000+ of hours saved
Accelerated development with enterprise-ready UI components.
Efficient file management
Streamlined workflows with document libraries without building them from scratch.
Industry
Software and technology
2 Years of delay avoided
Two years of delays prevented with proactive planning.
On-time delivery
Projects delivered on schedule using trusted controls.
Industry
IT services and IT consulting
Improved performance
Large datasets handled with easy customization and quick debugging.
Highly customizable
Plug-and-play controls with quick template integration.
Industry
Professional services
Instant access
Quick availability of features and resources.
Reduced dependencies
Fewer dependencies for faster development.
Rated by users across the globe
Syncfusion Windows Forms Resources
Learning
 Documentation
 Documentation


Awards
Greatness—it’s one thing to say you have it, but it means more when others recognize it. Syncfusion® is proud to hold the following industry awards.

