Trusted by the world’s leading companies

Overview
The UWP Map control is a powerful data visualization component that displays statistical information for a geographical area. It has highly interactive and customizable features such as zooming, panning, selecting, legends, markers, bubbles, and color mapping. Using the Map control,you can render various maps, such as sales, political-boundary, weather, electoral, and route maps.
Shape layers
Render geographical shapes or custom shapes in UWP Map.

Data
Bind shapefiles (.shp) and GeoJSON (.json) data to maps to render any geometric shape.
Customization
Customize the default style of a shape using the color, stroke, and thickness properties.
Custom shapes
Render any custom shape to represent building infrastructure, a sports stadium, plane or bus seat arrangements, and more.

Sublayer
Load multiple shape files in a single map view. For example, add a sublayer over a main shape layer to view geographic features such as rivers, valleys, and cities in a map of a country.
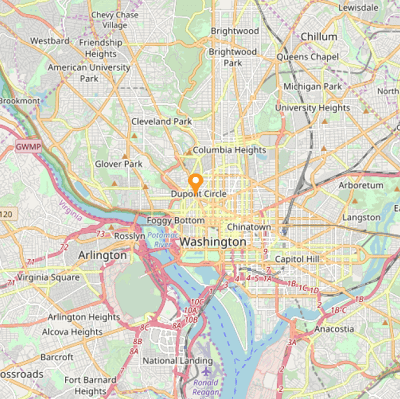
Imagery layers
Built-in support for external imagery services, such as Bing Maps and OpenStreetMap, is used to visualize satellite, aerial, and street maps, and other imagery tiles, without using shapefiles. Apart from Bing Maps and OpenStreetMap, you can also render maps from other map providers such as Google Maps and TomTom.
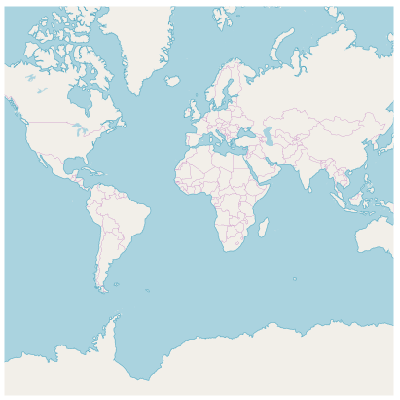
OpenStreetMap (OSM)
OpenStreetMap (OSM) is a map of the world built by a community of mapmakers that is free to use under an open license. It allows users to view geographical data in a collaborative way from anywhere on Earth.
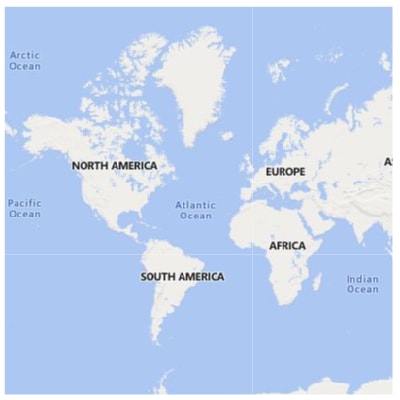
Bing Maps
Bing Maps, owned by Microsoft, is a map of the entire world. It supports three types of map views: Aerial, Aerial with Labels, and Road.
Auto zoom
Set the initial zoom level automatically based on map Geo-bounds or distance (KM/miles) from the Geo-point center value.
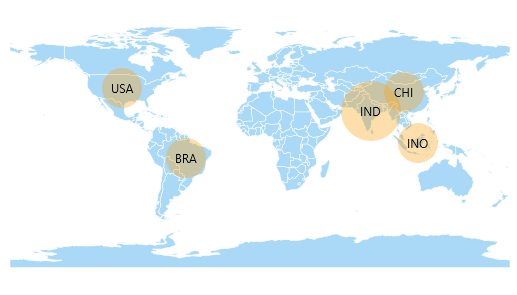
Data labels
Easily annotate UWP Map shapes with labels to improve the readability of a particular shape’s name.
Label customization
Customize the look and feel of default labels using font style, size, and color properties.

Smart label alignments
Align labels smartly within shape boundaries and trim or hide them to avoid labels overlapping.
Heat map
Produce a heat map by customizing shape colors based on the underlying shape value.

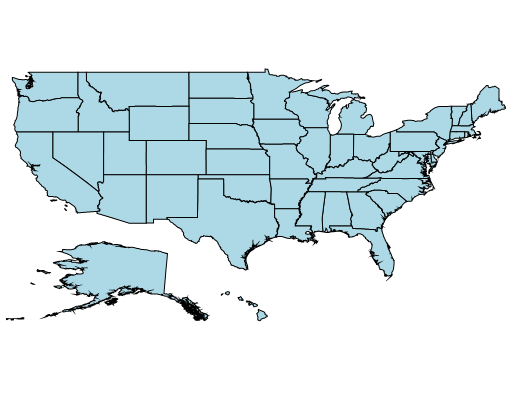
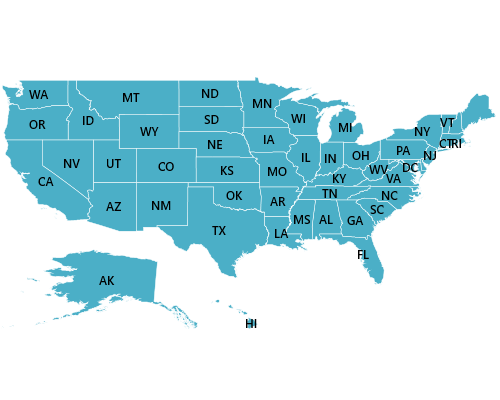
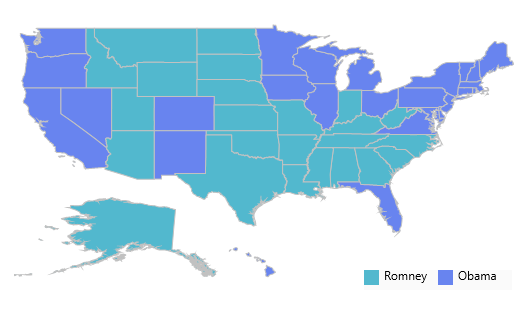
Equal color mapping
Equal color mapping differentiates a shape’s fill color based on its underlying value and color. For example, apply colors to states based on their winning political candidates.

Range color mapping
Apply colors to shapes by comparing their values with desired numeric ranges. For example, apply colors to states based on their population density.
Maps markers
Markers allow you to denote a place with symbols, like pins, or display a message at specific coordinates on a map.
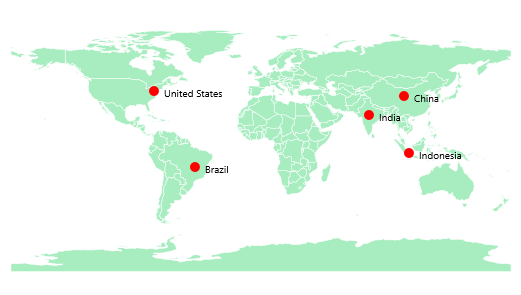
Marker types
Set the marker type to built-in shapes such as circles, diamonds, rectangles, or squares to highlight a place.
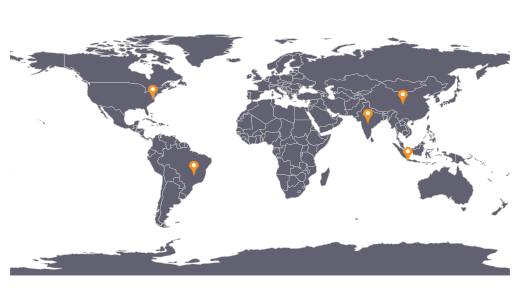
Custom markers
Customize markers by adding images or any custom shape to highlight a location.
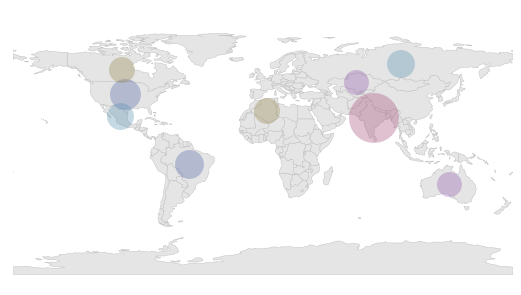
Map bubbles
Bubbles are used to add information to shapes, such as population density, land area, and more. They are rendered with various magnitudes and colors based on the underlying data values of the shapes.
Color customization
Customize the default color of a bubble and its transparency using the fill and opacity properties.
Size customization
Customize the minimum and maximum size of a bubble to enhance its readability.
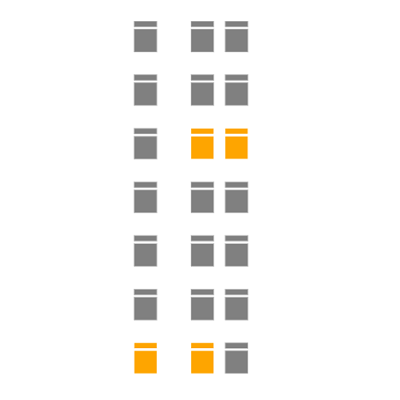
Map legend
Legends provide valuable information for interpreting maps by using colors, shapes, or other identifiers based on data.
Legend position
Move a legend to any position inside a map.
![]()
Icon customization
The default size of a legend icon can be customized.
User interactions
Interactive features such as selecting, zooming, and panning greatly enhance user experience.
Selection
Select or highlight an area or shape in order to center the view over that area on a map.
Zooming and panning
Zooming allows users to get a closer look at a particular area, and panning allows users to move a map around to focus on a specific area.
Drilling down
Drill down in a map to display different shape data located on another layer. For example, you can drill down to a continent in a world map to show the continent separately on another layer.
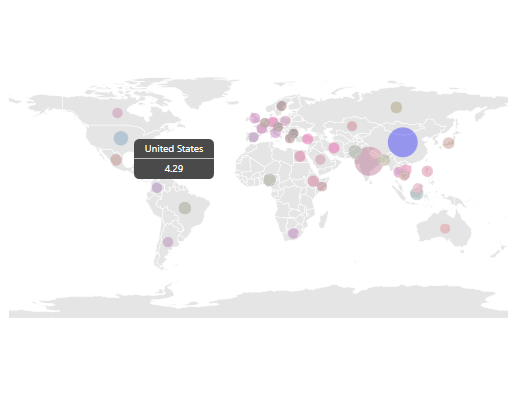
Tooltip
The tooltip control displays a pop-up with additional information about the shapes, markers, and bubbles when the end user taps the map elements.
110+ UWP CONTROLS
ALL CONTROLS
GRIDS
DATA VISUALIZATION
INPUT CONTROLS
CALENDAR
NAVIGATION
BUSINESS INTELLIGENCE
LISTS & DROPDOWN
NOTIFICATION
MISCELLANEOUS
FILE VIEWERS & EDITORS
Standalone UI SDKs
Integrate the DataGrid, Chart, Scheduler, Gantt, and Diagram UI components into applications to enable rich interaction and visualization, delivering a seamless user experience.
Document Solutions
Integrate the PDF Viewer, DOCX Editor, Spreadsheet Editor, and document-processing libraries into the UWP applications to enable a smooth user experience.
Our Customers Love Us
Having an excellent set of tools and a great support team, Syncfusion® reduces customers’ development time.Here are some of their experiences.

Excellent experience with Syncfusion!
Syncfusion is a product that makes life easier! I use it to create Blazor applications (server side and webassembly) and the controls speed up development a lot. Furthermore, if needed, it is possible to ask for direct support that is never long in coming!

Andrea Scarpante,

Sydea srl
The complete component set
It is the most complete component set available. Also very handy is the fact that there is a community edition, this gives me the opportunity to test thing at home without buying a separate license.

Johan Visser,

H and T Pawnbrokers
See Real Success Stories
Developers around the world trust Syncfusion’s Essential Studio to simplify complex projects and speed up delivery. With a vast library of UI controls, powerful SDKs, and reliable support, Essential Studio helps teams build enterprise-ready applications with confidence.
Read Our Customer StoriesIndustry
Software development
75% Cost reduction
50% Faster development
Industry
Utilities (oil and gas)
450+ hours saved
Streamlined processes and hours of development effort saved.
Advanced, flexible features
Empowered users through robust and versatile functionality.
Industry
Software and technology
1000+ of hours saved
Accelerated development with enterprise-ready UI components.
Efficient file management
Streamlined workflows with document libraries without building them from scratch.
Industry
Software and technology
2 Years of delay avoided
Two years of delays prevented with proactive planning.
On-time delivery
Projects delivered on schedule using trusted controls.
Industry
IT services and IT consulting
Improved performance
Large datasets handled with easy customization and quick debugging.
Highly customizable
Plug-and-play controls with quick template integration.
Industry
Professional services
Instant access
Quick availability of features and resources.
Reduced dependencies
Fewer dependencies for faster development.
Rated by users across the globe
Syncfusion UWP Resources
Learning
 Documentation
 Documentation


Awards
Greatness—it’s one thing to say you have it, but it means more when others recognize it. Syncfusion® is proud to hold the following industry awards.

