ASP.NET Core Charts - Interactive Graphs with Real-time Data
- 55+ chart types
- Lightning-fast performance
- Elegant animation
- Simple configuration and API
- Support for all modern browsers
- Mobile-friendly and responsive
- Detailed documentation
Trusted by the world’s leading companies

Overview
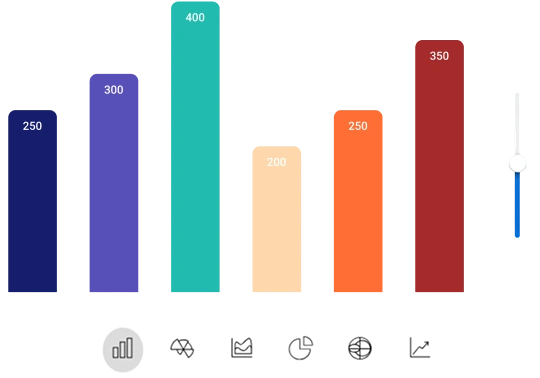
The ASP.NET Core Charts is a well-crafted charting component to visualize data. It contains a rich UI gallery of 55+ Charts and Graphs, ranging from line to financial that cater to all charting scenarios. Its high performance helps render large amounts of data quickly. It also comes with features such as zooming, panning, tooltip, crosshair, trackball, highlight, and selection.
Why choose Syncfusion ASP.NET Core Charts?
55+ Chart types
Ranging from simple day-to-day Charts like line charts, bar charts, area charts to complex financial charts that are highly customizable.
Chart animation
Charts for ASP.NET Core provides fluid animation to represent data with smooth transitions.
Performance
Well thought out efforts, and focuses mainly on fast paced performance to render 100k data in less than a second.
AI-Assisted Development
Build interactive data visualization experiences faster with the AI Coding Assistant and Syncfusion Agent Skills. Generate chart layouts, configure series and axes, and create analytical dashboards with minimal manual effort.
Data Editing
ASP.NET Core Charts with Rich UI provides drag and drop support to the rendered points. Data editing allows you to manipulate the data on a chart.
Trendlines
Shows the price direction and movement speed. Trendlines can be generated for Cartesian type series (Line, Column, Scatter, Area, Candle, HiLo, etc.) except bar.
Globalization and localization
Enables users from different locales to use them by formatting dates, currency, and numbering to suit preferences.
Exporting
Export Charts to PDF documents or as image formats such as SVG, PNG and JPEG, as well as export chart data to XLSX and CSV formats.
Powerful, user friendly, and feature-rich ASP.NET Core Charts for your business
ASP.NET Core Charts Code Example
Easily get started with the ASP.NET Core Charts using a few simple lines of C# code example as demonstrated below. Also explore our ASP.NET Core Charts Example that shows you how to render and configure the Charts in ASP.NET Core.
<ejs-chart id="container">
                <e-chart-primaryxaxis valueType="Category">
                </e-chart-primaryxaxis>
                <e-series-collection>
                    <e-series name="series1" xName="xValue" yName="yValue" dataSource="ViewBag.dataSource"
                              type="@Syncfusion.EJ2.Charts.ChartSeriesType.Line">
                    </e-series>
                </e-series-collection>
 </ejs-chart>
public class HomeController : Controller
{
public ActionResult Index()
{
List<ChartData> chartData = new List<ChartData>
{
new ChartData { xValue = "2014", yValue = 21 },
new ChartData { xValue = "2015", yValue = 24 },
new ChartData { xValue = "2016", yValue = 36 },
new ChartData { xValue = "2017", yValue = 38 },
new ChartData { xValue = "2018", yValue = 54 },
new ChartData { xValue = "2019", yValue = 57 },
new ChartData { xValue = "2020", yValue = 70 },
};
ViewBag.dataSource = chartData;
return View();
}
}
public class ChartData
{
public string xValue;
public double yValue;
}

Mobile first approach
Develop ASP.NET Core Charts with single code base, and well-thought-out mobile adaptive architecture that adapts to any web, mobile, or tablet environment. Render beautiful, responsive, interactive, and animated Charts within mobile devices.
Accessibility

Keyboard navigation
ASP.NET Core Charts ensures that every element is keyboard accessible. Major features like selection, highlight, tooltip, legend collapse and zooming and panning can be performed using keyboard commands alone; no mouse interaction is required. This helps in creating highly accessible applications using this component.

Screen reader
ASP.NET Core Charts views have complete WAI-ARIA accessibility support. This UI includes high-contrast visual elements, helping people with visual impairments have the best viewing experience. Also, valid UI descriptions are easily accessible through assistive technologies such as screen readers.

Right to left (RTL)
Right-to-left rendering allows displaying the text and layout of the ASP.NET Core Charts from right to left. This improves the user experience and accessibility for RTL languages.
Other supported frameworks
The Chart is available for the Blazor, React, Angular, JavaScript, Vue, and ASP.NET MVC frameworks. Explore its platform-specific options through the following links:


Supported browsers
The ASP.NET Core Charts works well with all modern web browsers, including Chrome, Firefox, Edge, Safari, and Opera.
Not sure how to create your first ASP.NET Core Charts? Our documentation can help.
I’d love to read it nowOther data visualization components that may help your business.


Frequently Asked Questions
Why should you choose Syncfusion ASP.NET Core Charts?
Supports 55+ Chart types and elegant animation.
Blazing fast load time and rich UI interaction in web apps.
Supports both rendering SVG and Canvas (for fast rendering).
You can add custom elements to the chart by using the annotations option.
When displaying data on several charts, synchronized charts enhance visualization by coordinating tooltips, crosshairs, selections, and zooming features across all charts.
Flexible data binding with support to use local and remote data sources such as JSON, RESTful services, OData services, and WCF services.
- One of the best ASP.NET Core Charts in the market that offers feature-rich UI to interact with the software.
Simple configuration and API.
- Supports all modern browsers.
- Mobile-touch friendly and responsive.
Expansive learning resources such as demos, and documentation to learn quickly and get started with ASP.NET Core Charts.
Where can I find the Syncfusion ASP.NET Core Charts demo?
You can find our ASP.NET Core Charts demo, which demonstrates how to render and configure the Charts control.
Can I download and utilize the Syncfusion ASP.NET Core Charts for free?
No, this is a commercial product and requires a paid license. However, a free community license is also available for companies and individuals whose organizations have less than $1 million USD in annual gross revenue, 5 or fewer developers, and 10 or fewer total employees.
How do I get started with Syncfusion ASP.NET Core Charts?
A good place to start would be our comprehensive getting started documentation.
Our Customers Love Us


See Real Success Stories
Developers around the world trust Syncfusion’s Essential Studio to simplify complex projects and speed up delivery. With a vast library of UI controls, powerful SDKs, and reliable support, Essential Studio helps teams build enterprise-ready applications with confidence.
Read Our Customer StoriesIndustry
Software development
75% Cost reduction
50% Faster development
Industry
Utilities (oil and gas)
450+ hours saved
Streamlined processes and hours of development effort saved.
Advanced, flexible features
Empowered users through robust and versatile functionality.
Industry
Software and technology
1000+ of hours saved
Accelerated development with enterprise-ready UI components.
Efficient file management
Streamlined workflows with document libraries without building them from scratch.
Industry
Software and technology
2 Years of delay avoided
Two years of delays prevented with proactive planning.
On-time delivery
Projects delivered on schedule using trusted controls.
Industry
IT services and IT consulting
Improved performance
Large datasets handled with easy customization and quick debugging.
Highly customizable
Plug-and-play controls with quick template integration.
Industry
Professional services
Instant access
Quick availability of features and resources.
Reduced dependencies
Fewer dependencies for faster development.
Rated by users across the globe


 Figma Download
Awards
Greatness—it’s one thing to say you have it, but it means more when others recognize it. Syncfusion® is proud to hold the following industry awards.


Recent activities in ASP.NET Core Charts tutorials
The ASP.NET Core Charts tutorial videos posts will guide you in building your first app with ASP.NET Core components. They provide problem-solving strategies, describe features and functionalities, announce new feature releases, explain best practices, and showcase example scenarios. Explore our latest posts on our tutorial video channels for ASP.NET Core Charts updates.