



Transform your applications today by downloading our free evaluation version
Overview
The UWP Chart control is optimized to visualize large quantities of data in an elegant way. Its rich feature set includes functionalities like data binding, multiple axes, legends, animations, data labels, annotations, trackballs, tooltips, gradient, technical indicators, and zooming.
Blazing fast performance
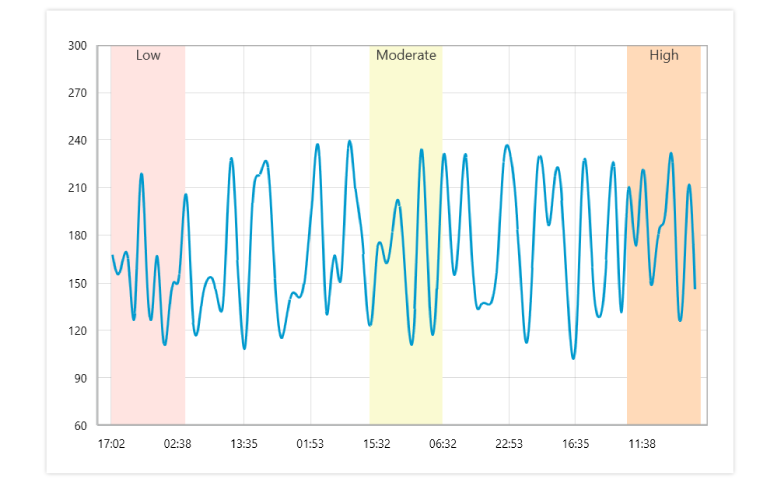
Chart includes several data storage and rendering optimizations to achieve the best possible performance when both plotting large volumes of data and handling high frequency real-time data.
Load time
100,000 data points can be rendered in less than a second.

Real-time updates
Chart can seamlessly handle quick updates while maintaining excellent refresh rates.

Smooth zooming
This control provides a smooth and responsive zooming experience on both touch and mouse-enabled interfaces.
Chart types
Chart includes functionality for plotting more than 55 chart types. Each chart type is easily configurable with built-in support for creating stunning visual effects.
- Related data can be plotted using bubble and scatter charts.
- Many area type charts, like area, spline area, and stacking area, are available for quantitative analysis.
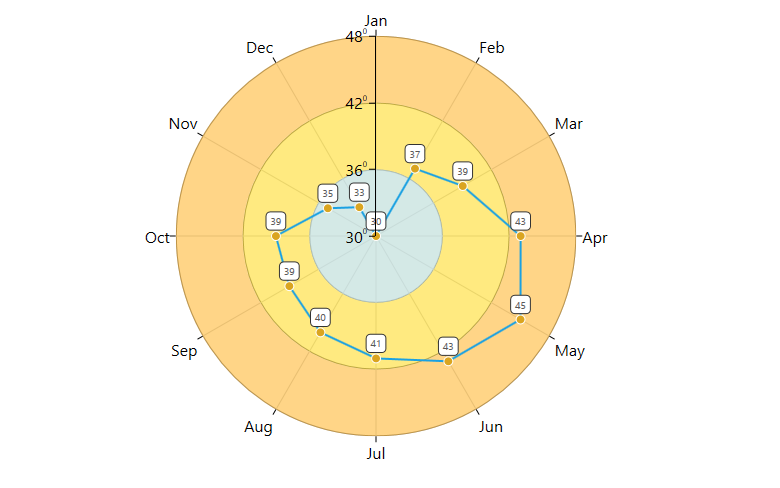
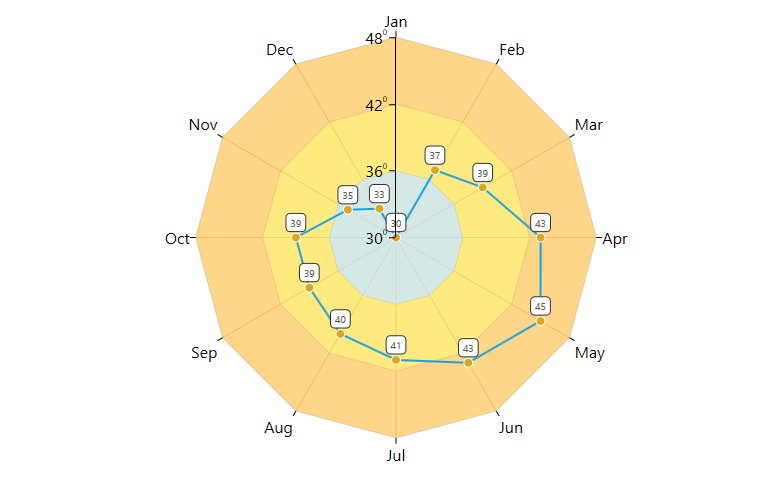
- Radar and polar charts can be used for displaying multivariate data.
- Several 3D chart types are also available.
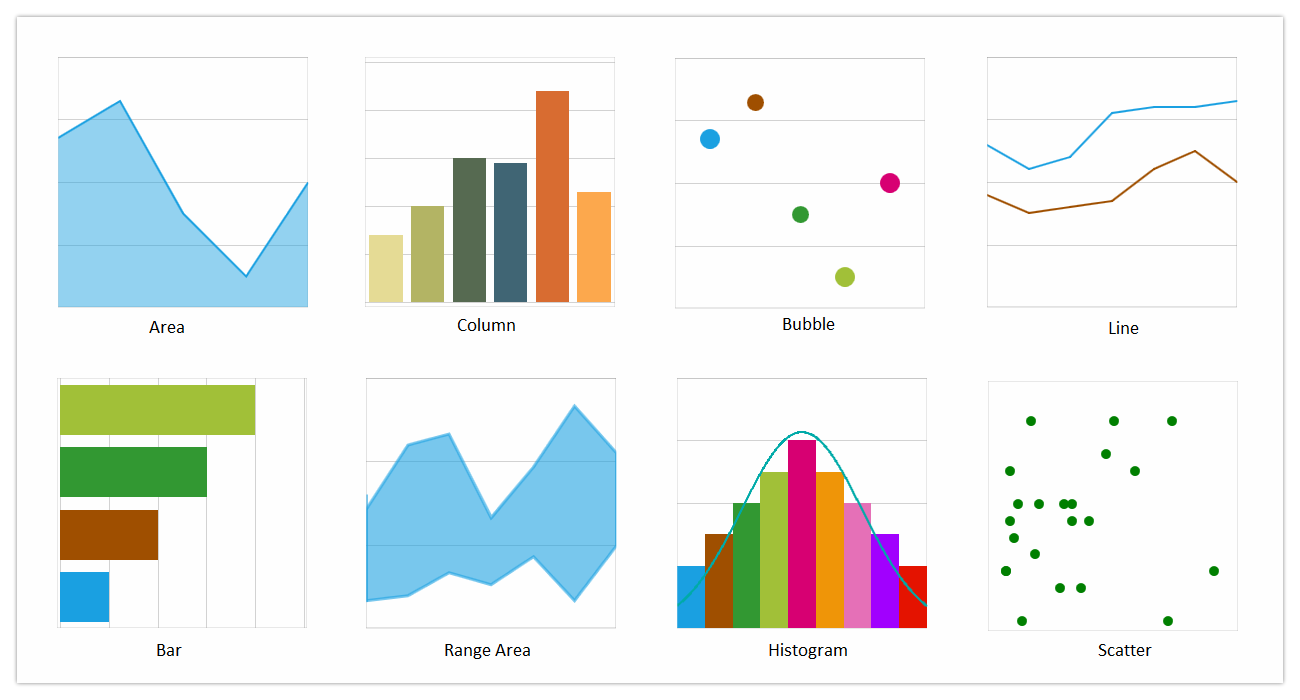
UWP area chart, UWP column chart, UWP bubble chart, UWP line chart, UWP bar chart, UWP range area chart, UWP histogram chart, UWP scatter chart
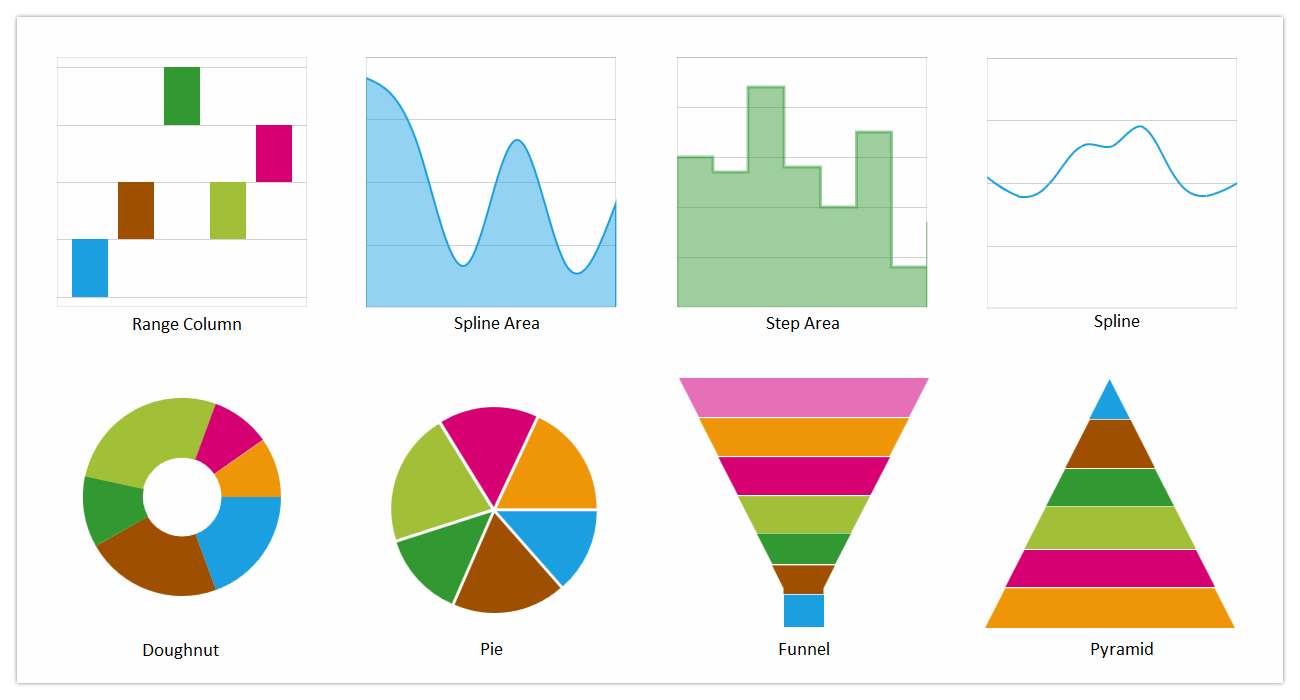
UWP range column chart, UWP spline area chart, UWP step area chart, UWP spline chart, UWP doughnut chart, UWP pie chart, UWP funnel chart, UWP pyramid chart
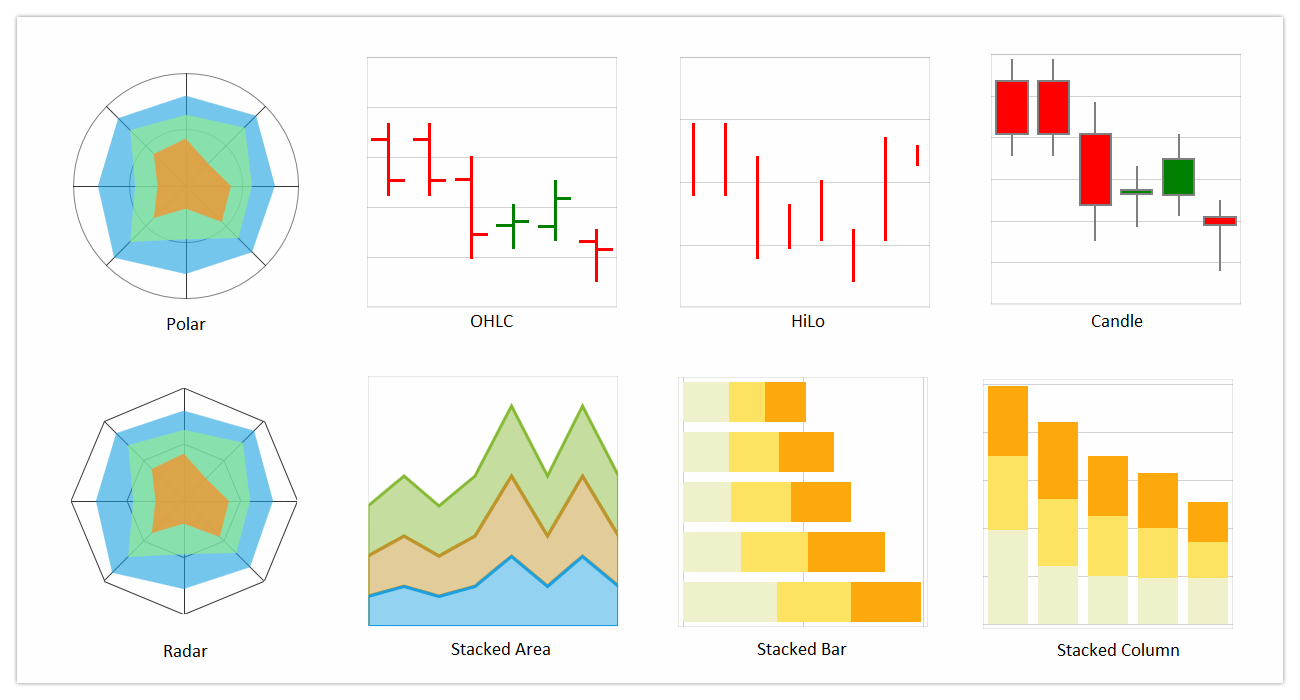
UWP polar chart, UWP radar chart, UWP ohlc chart, UWP stacked area chart, UWP hilo chart, UWP stacked bar chart, UWP candle chart, UWP stacked column chart
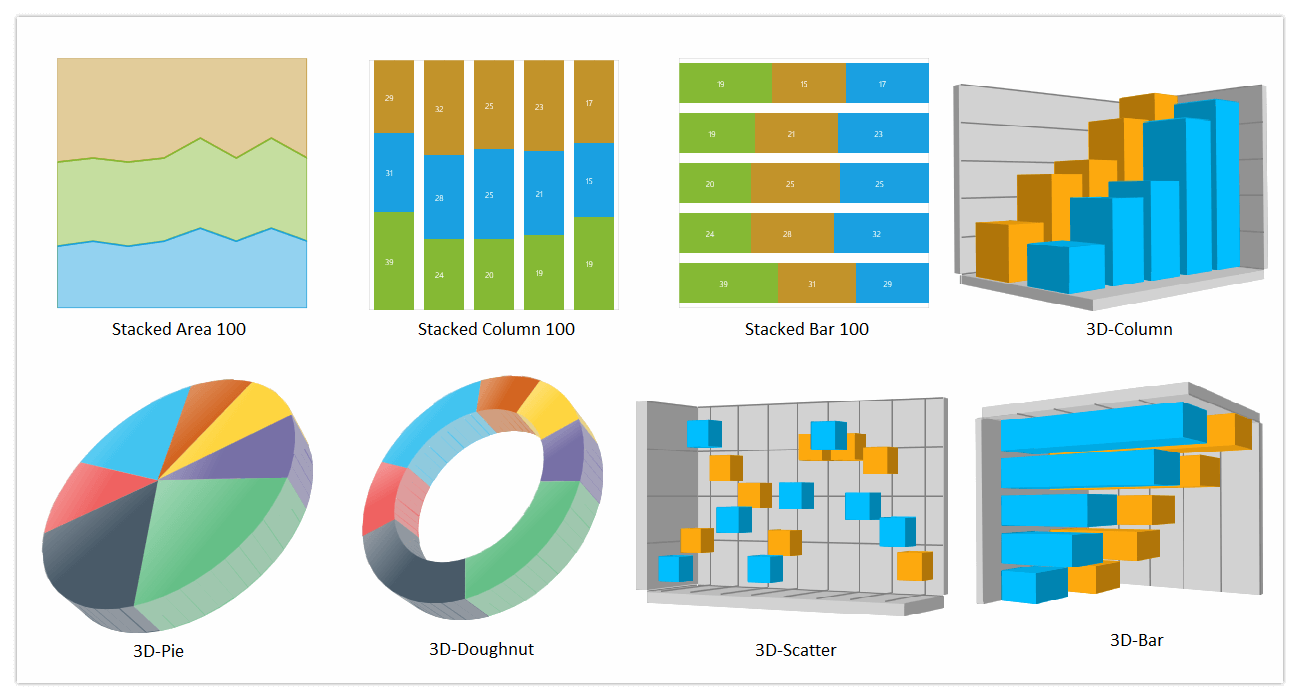
UWP stacked area 100 chart, UWP stacked column 100 chart, UWP stacked bar 100 chart, UWP 3D column chart, UWP 3D pie chart, UWP 3D doughnut chart, UWP 3D scatter chart, UWP 3D bar chart
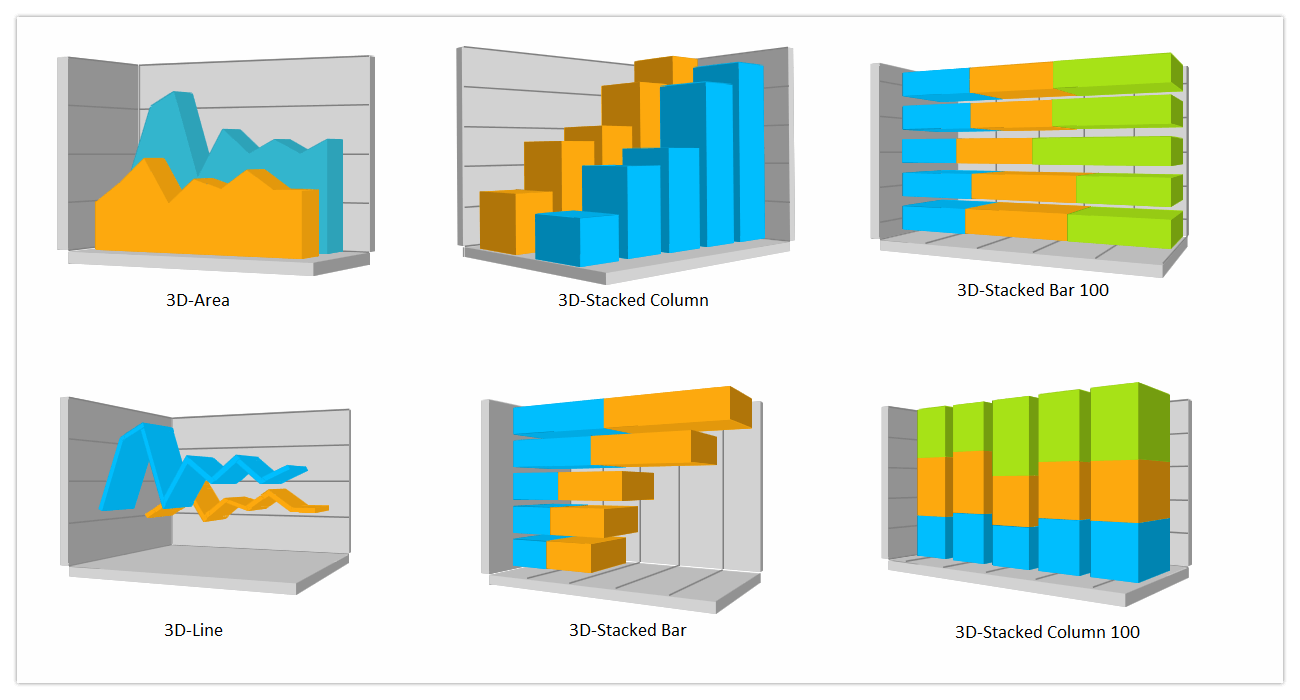
UWP 3D area chart, UWP 3D stacked column chart, UWP 3D stacked bar 100 chart, UWP 3D line chart, UWP 3D stacked bar chart, UWP 3D stacked column 100 chart
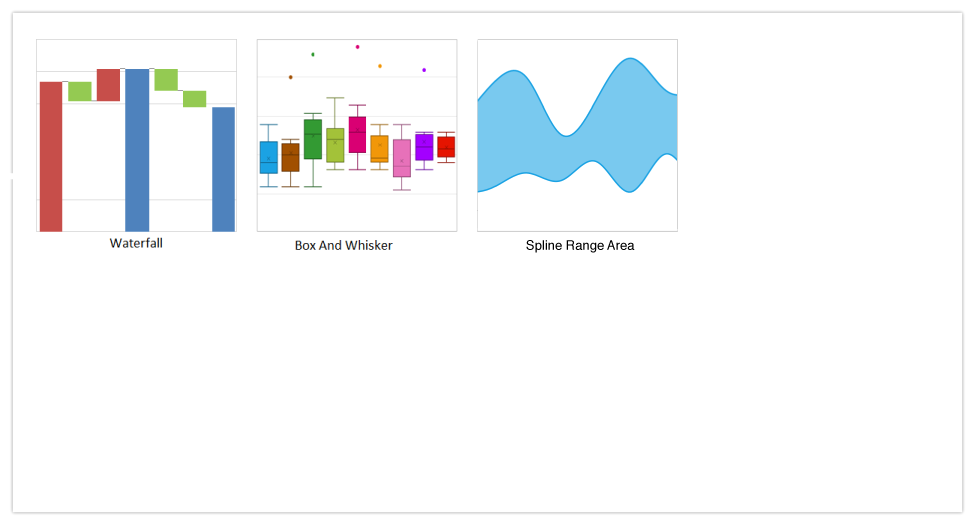
UWP waterfall chart, UWP box and whisker chart, UWP spline range area chart
Customizable axis
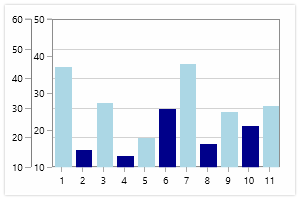
Several specialized axis types are available for plotting different value types like double, string, and date-time.
Multiple axes
Charts can be customized with multiple axes.
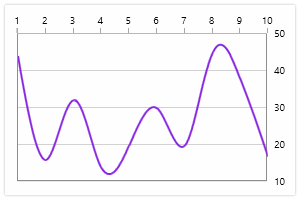
Opposed axis
Chart supports opposed axes being rendered on the side opposite to the default position.
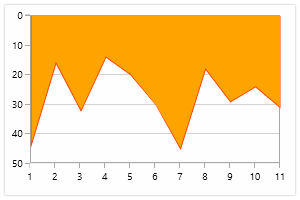
Inverted axis
Support for inverting values in an axis.
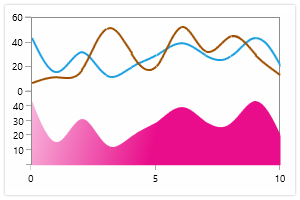
Multiple panes
There is support to add multiple panes to a chart.
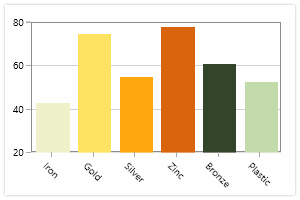
Axis labels
Chart provides many customization options for axis labels, including positioning, placement, label format, and rotation. It also has options for avoiding labels overlapping.
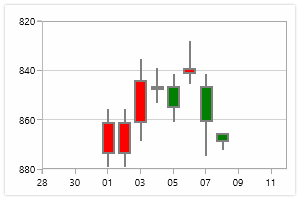
Smart range calculation
The best possible axis ranges and intervals are calculated automatically based on the given values. The ranges can also be further customized using range padding.
Series customization
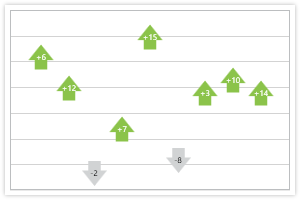
Custom series
Series templates can be customized.
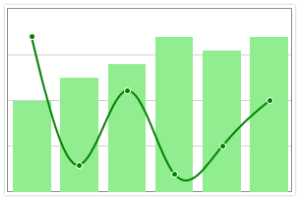
Series combinations
Series combinations can plot different chart types in the same plot area.
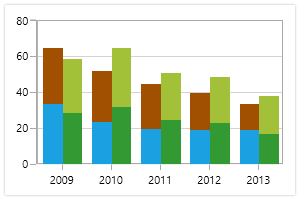
Grouping series
Stacking series can be grouped to a single unit.
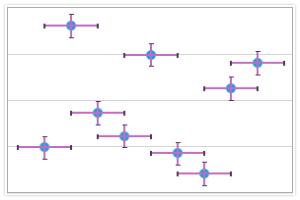
Error bars
Error bars are used to plot possible errors or uncertainty in data points.
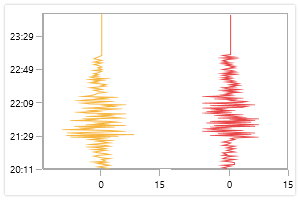
Vertical charts
Axis direction can be mirrored for applications where it is required that the series be plotted vertically.
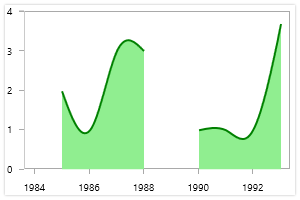
Empty points
Empty point values are elegantly handled with several customization options.
Axis scale break
An axis scale break allows users to view different ranges in the same chart area without having a huge space in the plot area.

Data labels
Data points can be easily annotated with labels to help improve the readability of data.
Pie and doughnut data labels are smartly arranged to avoid intersection when there are large amounts of data.
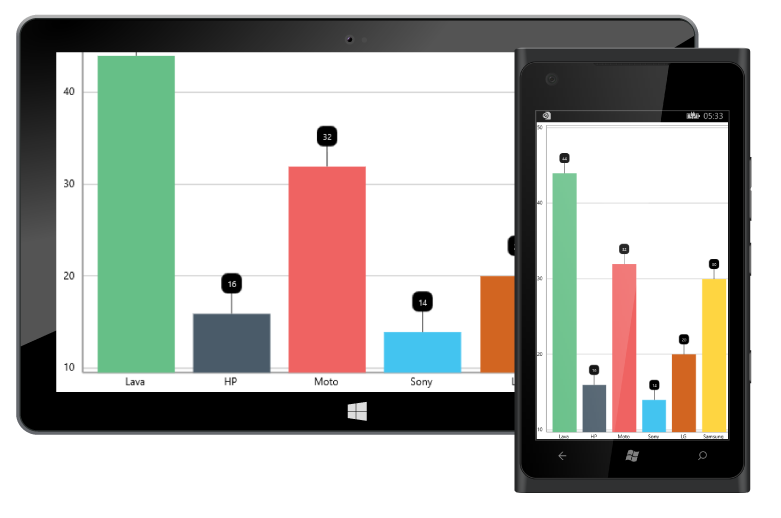
Legends
Legends provide additional information that is helpful in identifying individual series in a chart. They can be docked to the left, right, top, or bottom positions around the chart area.
Multiple legends can also be added to chart panes.
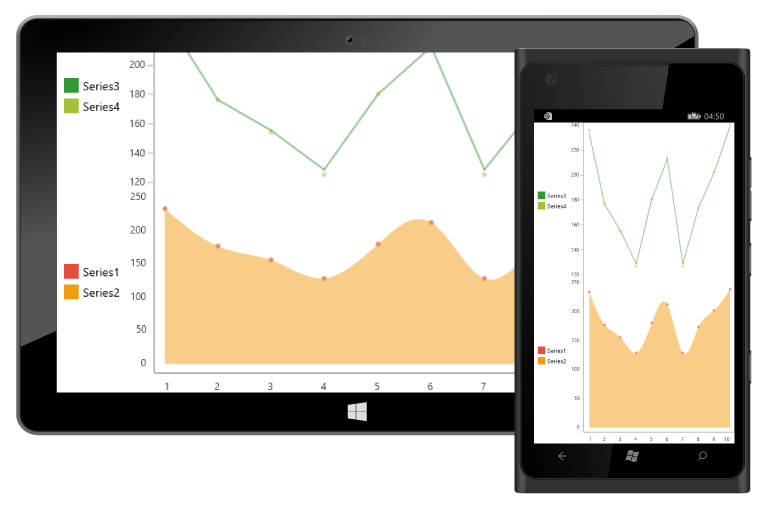
Interactive features
The end user experience is greatly enhanced by a set of included user interaction features, such as trackball, selection, zooming, and tooltip.
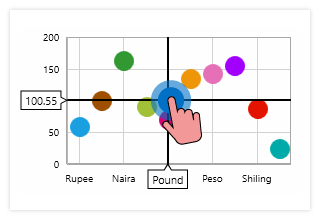
Crosshair
A crosshair is used to inspect or focus on an individual data point.
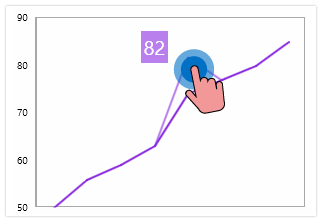
Data editing
Chart lets users edit data points visually.
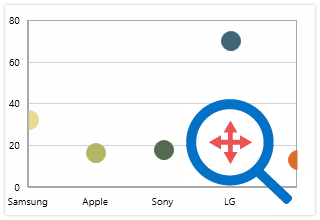
Zoom and pan
Zooming and panning are useful when visualizing a large amount of data.
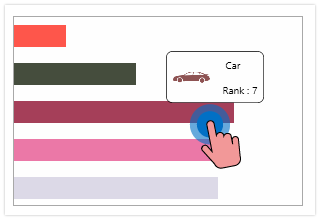
Tooltips
Tooltip displays a pop-up with additional information when the mouse is hovered over a data point.
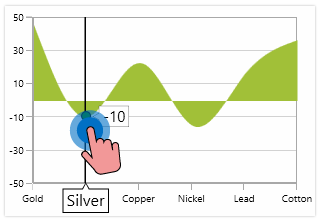
Trackball
Trackball is used to track a data point closest to the current mouse position or touch contact point.
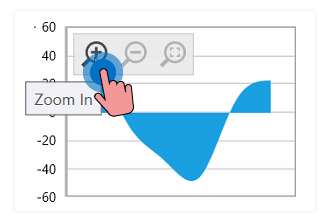
Zooming toolbar
The zooming toolbar contains buttons for performing actions like zooming in and out, reset, pan, etc.
Selection
End users can interactively select or highlight a series or a data point.
There is also built-in support for performing multiple selection.
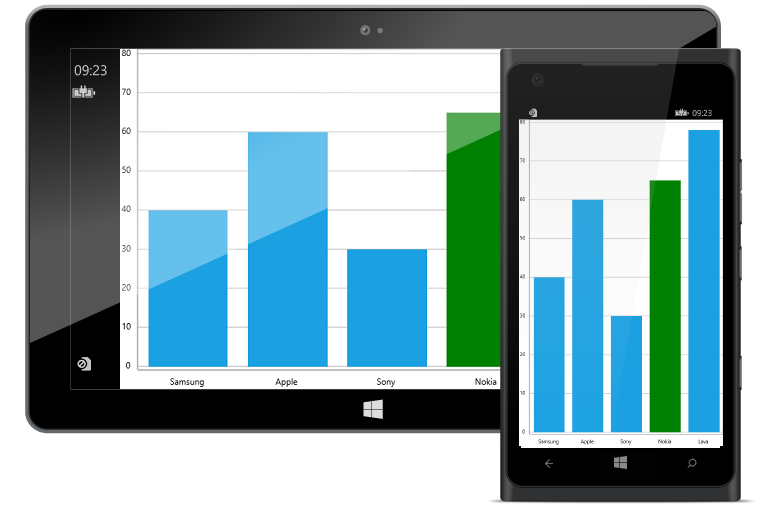
Annotations
Annotations display metadata about the chart or series at a specific point of interest in the plotting area.
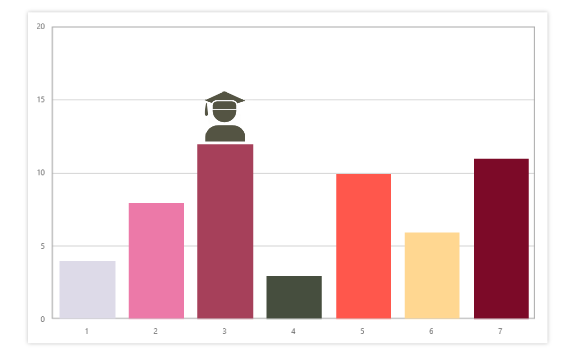
Images
Images can be added as annotations.
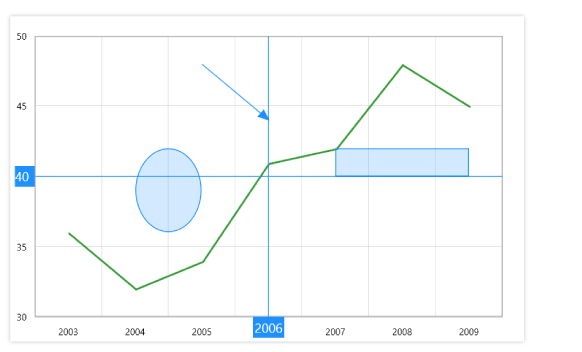
Shapes
All the basic annotation elements like lines, text, and arrows are available.
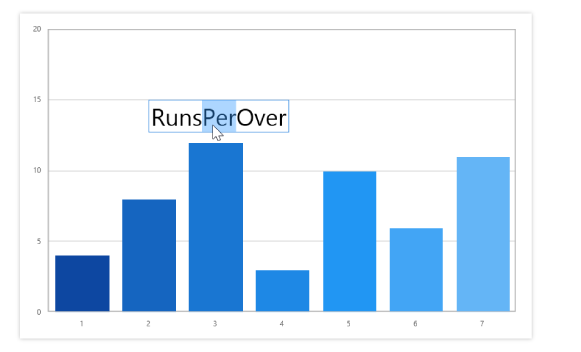
Editable text
Text can be edited interactively.
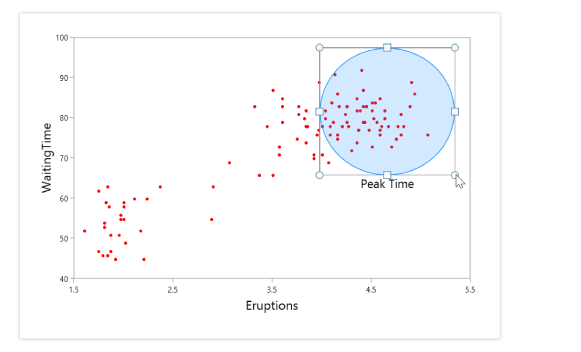
Drag and resize
Annotations can be resized and dragged across the plot area.
Strip lines
Specific regions in the chart area can be customized using strip lines.
Technical indicators
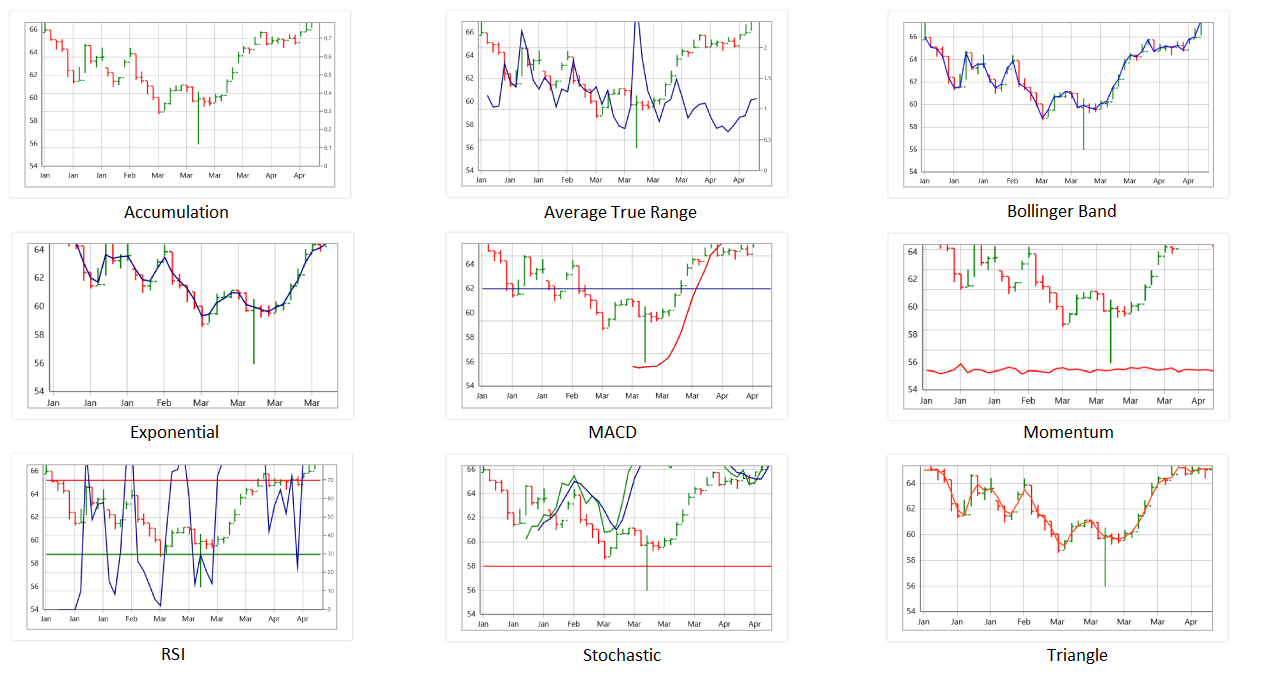
There’s built-in support for RSI, momentum, Bollinger band, accumulation distribution, RSI, true average, stochastic, MACD, and triangular average indicators.
Trendlines
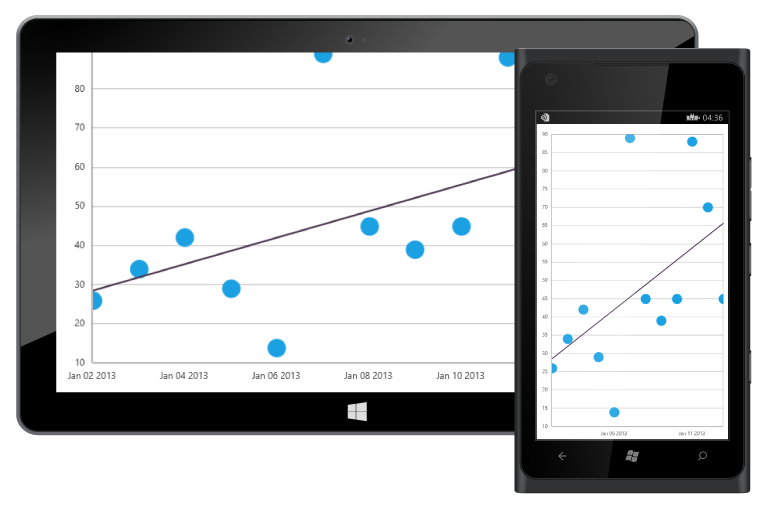
There’s built-in support for rendering linear, exponential, logarithmic, power, and polynomial trendlines.
Grouping and aggregation
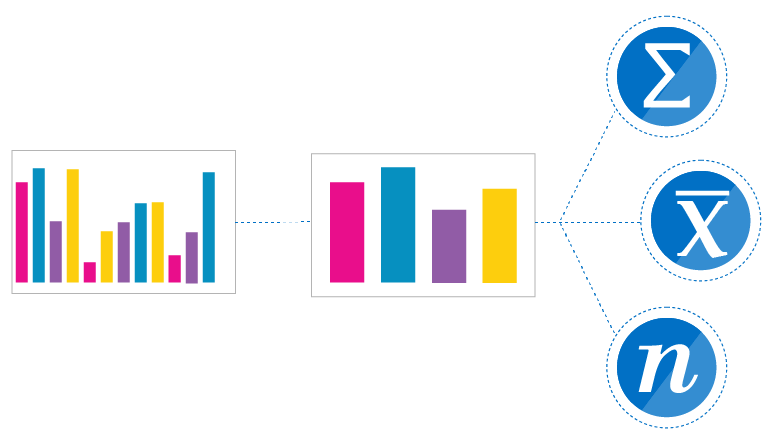
Data points with similar categories can be grouped and aggregated using aggregate functions.
Localization
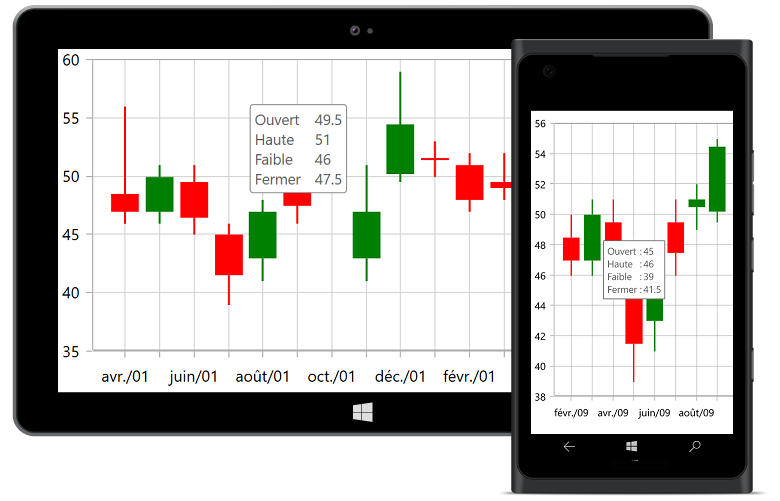
Any static text in the chart can be localized to any desired language.
Palette
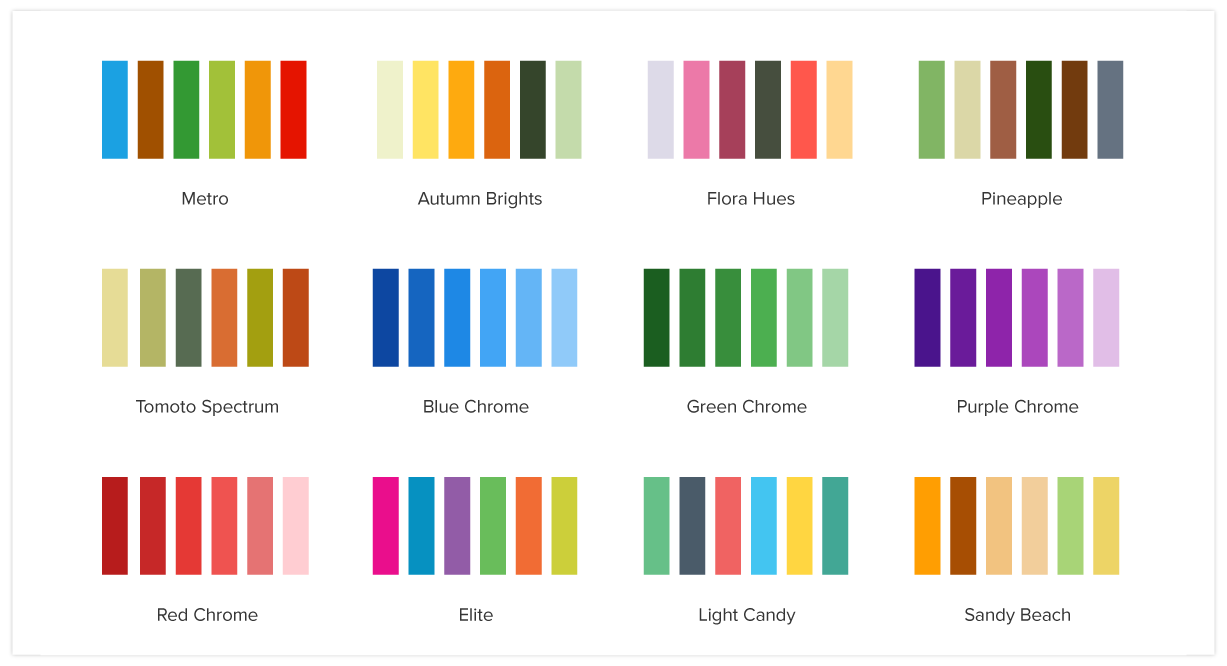
Chart provides more than 10 built-in palettes. Custom palettes can also be created as needed.
Watermark
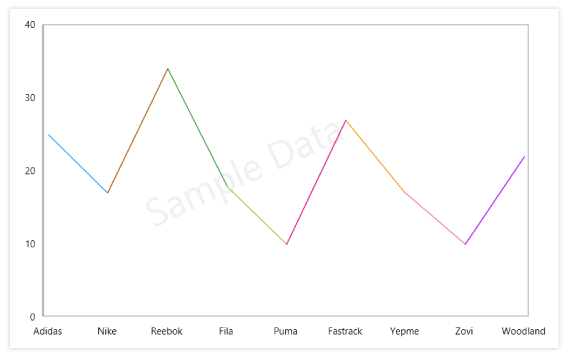
Watermarks are commonly used for displaying confidential and copyright information.
Exporting and printing
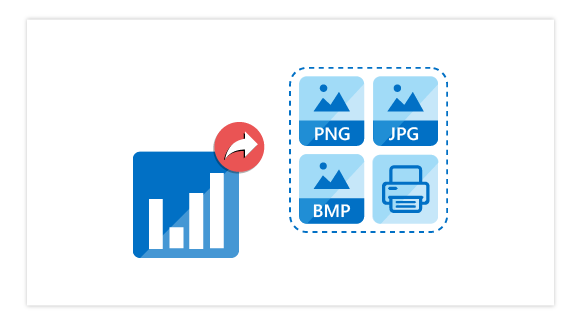
The chart can be printed and also exported into image formats like JPEG, BMP, PNG, TIFF, and XPS.
110+ UWP CONTROLS
ALL CONTROLS
GRIDS
DATA VISUALIZATION
INPUT CONTROLS
CALENDAR
NAVIGATION
BUSINESS INTELLIGENCE
LISTS & DROPDOWN
NOTIFICATION
MISCELLANEOUS
FILE VIEWERS & EDITORS
Standalone UI SDKs
Integrate the DataGrid, Chart, Scheduler, Gantt, and Diagram UI components into applications to enable rich interaction and visualization, delivering a seamless user experience.
Document Solutions
Integrate the PDF Viewer, DOCX Editor, Spreadsheet Editor, and document-processing libraries into the UWP applications to enable a smooth user experience.
Our Customers Love Us
Having an excellent set of tools and a great support team, Syncfusion® reduces customers’ development time.Here are some of their experiences.

Everything works perfect, examples are great and support team tries to do their best to help
Support and amount of tutorials. They help a lot to understand the basics, of what syncfusion can suggest. I use data grids, charts. It has a good design too. It’s very good.

Arnoldas A,

Junior Node.JS Developer
Best Mobile Chart Solution for Flutter - most professional and responsive engineering and support
Syncfusion Team is World Class! - We discovered a problem implementing the Syncfusion Charts, Submitted a support ticket - immediate response & help. The Engineers confirmed the problem - and immediately started creating a new version that fixed the problem, they kept in contact with me - in a few days, the new version was ready and it works flawlessly. If you are looking for a team that will support you and work with your DEV team rapidly and responsively - then Syncfusion is for you. Best charting solution for mobile (we are using the Flutter plug-ins) - works great on the latest IOS & Android Builds - very customizable - great training and support - We highly recommend Syncfusion for the products & equally the customer & dev support. Very pleasant to work with as well ;-)

Don M,
Owner/Developer
See Real Success Stories
Developers around the world trust Syncfusion’s Essential Studio to simplify complex projects and speed up delivery. With a vast library of UI controls, powerful SDKs, and reliable support, Essential Studio helps teams build enterprise-ready applications with confidence.
Read Our Customer StoriesIndustry
Software development
75% Cost reduction
50% Faster development
Industry
Utilities (oil and gas)

450+ hours saved
Streamlined processes and hours of development effort saved.

Advanced, flexible features
Empowered users through robust and versatile functionality.
Industry
Software and technology
1000+ of hours saved
Accelerated development with enterprise-ready UI components.

Efficient file management
Streamlined workflows with document libraries without building them from scratch.
Industry
Software and technology

2 Years of delay avoided
Two years of delays prevented with proactive planning.

On-time delivery
Projects delivered on schedule using trusted controls.
Industry
IT services and IT consulting

Improved performance
Large datasets handled with easy customization and quick debugging.

Highly customizable
Plug-and-play controls with quick template integration.
Industry
Professional services
Instant access
Quick availability of features and resources.
Reduced dependencies
Fewer dependencies for faster development.
Rated by users across the globe
Syncfusion UWP Resources
Learning
 Documentation
 Documentation


Awards
Greatness—it’s one thing to say you have it, but it means more when others recognize it. Syncfusion® is proud to hold the following industry awards.