ASP.NET Core Pivot Table - Blazing-Fast Pivot Grid
- Organize and summarize pivot data in grids and charts.
- Load large volumes of data with high performance.
- Easily filter, sort, aggregate, and group pivot data.
- View detailed or abstract data using drill down or up.
- Experience seamless interaction and editing capabilities.
Quick Overview Video

Trusted by the world’s leading companies

Overview
The ASP.NET Core Pivot Table is a powerful control used to organize and summarize business data and display the result in a cross-table format. It includes major functionalities such as data binding, drilling up and down, Excel-like filtering and sorting, editing, Excel and PDF exporting, several built-in aggregations, pivot table field list, and calculated fields. A high volume of pivot data can be loaded without performance degradation using row and column virtualization.
Why choose the Syncfusion ASP.NET Core Pivot Table?
High performance
The Pivot Table is a powerful data visualization tool designed for fast-paced performance when loading millions of records.
Seamless data binding
Bind data seamlessly from local and remote sources including: file formats (JSON, CSV), service protocols (OData, RESTful APIs), SQL databases (MySQL, Microsoft SQL Server, PostgreSQL, Oracle), NoSQL databases (MongoDB, Elasticsearch), and cloud data warehouses like Snowflake.
Flexible editing
Users can perform actions on raw data at runtime, including create, read, update, and delete. Through an interactive user interface, the control provides several edit modes, including inline, dialog, batch, and column.
Integration with charts
Users can easily integrate the Pivot Table with independently rendered pivot data. It has support for more than 20 chart types.
Conditional formatting
Users can easily change a Pivot Table cell value’s appearance(background color, font color, font family, and font size) as required.
AI-Assisted Development
Build powerful data summarization experiences faster with the AI Coding Assistant and Syncfusion Agent Skills. Generate pivot layouts, aggregations, grouping, and drill-down analytics with minimal manual effort.
Attractive, customizable themes
Cutting-edge design with several built-in themes, such as Fluent, Tailwind CSS, Bootstrap, Material, and Fabric. Utilize the online Theme Studio tool to customize themes easily.
Globalization and localization
Enables users from different locales to use the component by formatting dates, currency, and numbering to suit preferences.
ASP.NET Core Pivot Table code example
Get started with the ASP.NET Core Pivot Table using a few simple lines of C# code, as demonstrated in the following. Also, explore this ASP.NET Core Pivot Table example, which shows you how to render and configure the control.
<ejs-pivotview id="PivotView" width="100%" height="350">
    <e-datasourcesettings dataSource="@ViewBag.DataSource">
        <e-rows>
            <e-field name="Country" caption="Country"></e-field>
            <e-field name="Products" caption="Products"></e-field>
        </e-rows>
        <e-columns>
            <e-field name="Year"></e-field>
        </e-columns>
        <e-values>
            <e-field name="Sold" caption="Unit Sold"></e-field>
            <e-field name="Amount" caption="Sold Amount"></e-field>
        </e-values>
    </e-datasourcesettings>
</ejs-pivotview>
public ActionResult Index()
{
var data = GetPivotData();
ViewBag.DataSource = data;
return View();
}
public List<PivotData> GetPivotData()
{
List<PivotData> pivotData = new List<PivotData>();
pivotData.Add(new PivotData { Sold = 31, Amount = 52824, Country = "France", Products = "Mountain Bikes", Year = "FY 2016", Quarter = "Q1" });
pivotData.Add(new PivotData { Sold = 51, Amount = 86904, Country = "France", Products = "Mountain Bikes", Year = "FY 2015", Quarter = "Q2" });
pivotData.Add(new PivotData { Sold = 51, Amount = 92824, Country = "Germany", Products = "Mountain Bikes", Year = "FY 2016", Quarter = "Q1" });
pivotData.Add(new PivotData { Sold = 61, Amount = 76904, Country = "Germany", Products = "Mountain Bikes", Year = "FY 2015", Quarter = "Q2" });
pivotData.Add(new PivotData { Sold = 91, Amount = 67824, Country = "United States", Products = "Mountain Bikes", Year = "FY 2015", Quarter = "Q1" });
pivotData.Add(new PivotData { Sold = 81, Amount = 99904, Country = "United States", Products = "Mountain Bikes", Year = "FY 2015", Quarter = "Q2" });
return pivotData;
}
public class PivotData
{
public int Sold { get; set; }
public double Amount { get; set; }
public string Country { get; set; }
public string Products { get; set; }
public string Year { get; set; }
public string Quarter { get; set; }
}Classic layout
The classic (tabular) layout is designed to enhance data visibility by presenting information in a traditional table format. In this layout, each row label is displayed distinctly at various levels across separate columns for clarity and better organization. This structured approach simplifies the analysis of datasets, making it easier to interpret relationships and trends within the data through a detailed, organized, and user-friendly table format.


Pivot charts
An ASP.NET Core pivot chart can easily be integrated with pivot data rendered independently. It includes support for plotting more than 20 chart types. The end-user experience is greatly enhanced with a set of user-interaction features such as drill up, drill down, zoom, pan, crosshairs, trackball, events, selection, and tooltip. Highly interactive field list options are available for generating reports from the relational data dynamically.
Virtual scrolling
Large amounts of data can be divided and displayed in the rows and columns of the current viewport using the virtual scrolling feature. Users can navigate to a desired view by scrolling the vertical and horizontal scrollbars.

Paging
Large amounts of data can be divided and displayed page by page with the paging feature. The pager UI allows users to navigate to a desired page using the navigation buttons or an input text box. Row and column pager sizes can be changed independently at runtime. Furthermore, toggle the position of the row and column pagers, modify their visibility, and visualize them using a compact view mode.
Pivot Table field list and group fields
The ASP.NET Core Pivot Table field list and group fields options are automatically populated with fields from the bound data source. They allow end users to drag, filter, and sort fields, and create pivot reports at runtime.


OLAP data binding
The Pivot Table can be connected to an OLAP cube, and its result can be visualized in both tabular and graphical formats.
Defer layout update
Users can refresh the control on demand instead of during every UI interaction in the Pivot Table.

Drill down and up
The built-in drill-down (expand) and drill-up (collapse) functionalities visualize data in detailed views and abstract views, respectively. By default, the data is displayed in a grouped manner.
Editing and updating
Users can create, read, update, and delete operations for raw data at runtime and update their changes to the underlying data source, reflecting the information in all corresponding cells. The Pivot Table control supports various edit modes such as inline, dialog, batch, and column edit through an interactive UI.

Filtering
Built-in member filters and Excel-like filters with advanced filtering options can be used to filter and view data as required. It is also possible to filter data programmatically in the Pivot Table.

Member filtering
Filter members in a pivot table to filter data displayed based on values in the row or column axes.
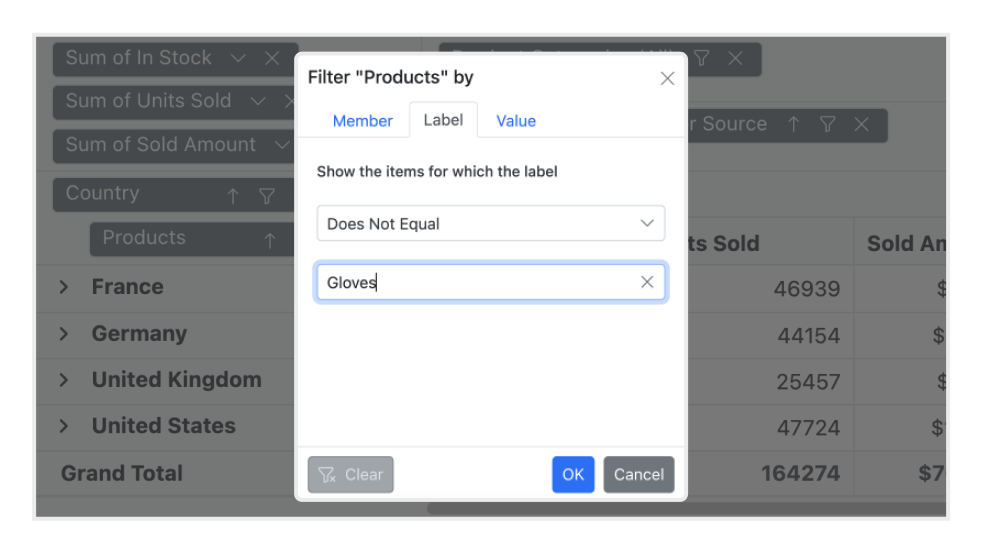
Label filtering
Use Excel-like filtering options in column and row headers based on label text, dates, or numbers.

Value filtering
Use Excel-like filtering options in column and row headers based on grand total values.
Sorting
Use sorting to order rows and columns based on labels or values.

Header sorting
Order column and row header text either in ascending or descending order.

Column sorting
Column sorting, also known as value sorting, orders the column values either in ascending or descending order. It is performed by clicking the header of the column to be sorted.

Custom sorting
Arrange field headers in column and row axes according to the user-defined order.
Aggregation
Users can perform calculations on a group of values using the aggregation option. By default, values are added together. The other aggregation types are average, minimum, maximum, count, distinct count, product, index, population standard deviation, sample standard deviation, population variance, sample variance, running totals, difference from, percent of difference from, and percent of grand total.
Calculated fields
Calculated or unbound fields generate unique fields with users’ calculated values by executing a simple, user-defined formula.


Drill through
The drillthrough feature easily obtains a list of raw items for a particular value cell or summary cell.
Totals
Subtotals and grand totals are calculated automatically by the pivot engine inside the control and displayed in the Pivot Table to help users make decisions more quickly. Also, users can show or hide subtotals and grand totals for rows and columns.


Conditional formatting
Users can define conditions that, when met, format font style, text color, background color, and font size for values and summary cells.
Number and date formatting
Number and date formatting help transform the appearance of the actual cell values.


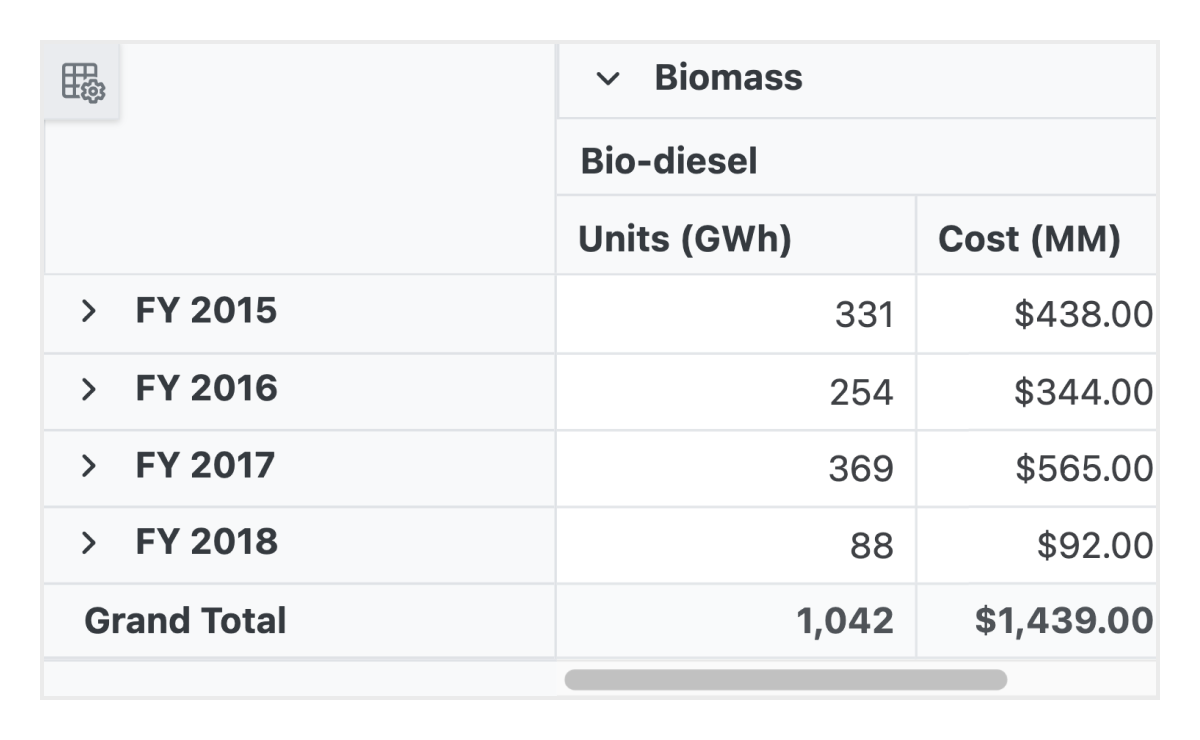
Grouping date and number
The Pivot Table control automatically groups dates and numbers, so the date type can be formatted and displayed based on year, quarter, month, day, and more. The number type can be grouped by range, such as 1–5 or 6–10.
Frozen headers
Users can freeze row and column headers to compare them with cell values.

Columns and rows

Resize
Change a column width at runtime by simply dragging the rightmost boundary of the column header. A scroll bar will appear when the content width exceeds the control width.

Reorder
Users can reorder columns either through user interaction or programmatically. Simply dragging and dropping a column header into the desired column position will reorder the columns.

Hyperlinks
Users can add hyperlinked text to a cell to redirect to external resources. The control allows them to perform custom operations programmatically.


Tooltips
A tooltip provides basic information about a cell while hovering over it with the pointer.

Cell templates
With cell templates, users can easily add features like images, checkboxes, and text nodes to any cell.

Toolbars
A toolbar enhances user interaction and provides access to frequently used features. These features include new report, save report, save as report, rename report, delete report, report list, show grid, show chart, show or hide totals, export reports, and more.
Exporting
Export the ASP.NET Core Pivot Table data to Excel, PDF, and CSV formats. Users can also customize the exported document by adding header, footer, and cell properties like type, style, and position programmatically.

Export to native Excel PivotTable
Users can export the Syncfusion Pivot Table directly to Microsoft Excel’s native PivotTable format, not just as a static table or flattened data. This ensures that all interactive features are preserved, allowing users to fully utilize Excel’s PivotTable functionalities.
Key advantages:
- Native Excel PivotTable: Exports to the actual PivotTable format used by Excel, preserving rows, columns, values, and filters.
- Fully interactive in Excel: Continue to sort, filter, expand/collapse groups, and modify field lists just like in your original pivot.
- Reusable layout: Save time by exporting your configured pivot layout for future use or easy sharing.
Optimized for mobile devices

Touch support
All features will work on touch devices easily. Features such as drilling up, drilling down, filtering, sorting, and report manipulation can be done on the fly.

Responsiveness
The responsive design allows the control to be viewed on various devices.
Accessibility

Keyboard navigation
The Pivot Table ensures that every cell is keyboard accessible. Major features like sorting, selection, and editing can be performed using keyboard commands alone; no mouse interaction is required. This helps create highly accessible applications using this component.

Right to left (RTL)
The Pivot Table supports RTL rendering, allowing the text and layout to be displayed from right to left.
Other supported frameworks
The Pivot Table is also available for the Blazor, React, Angular, JavaScript, Vue, and ASP.NET MVC frameworks. Explore its platform-specific options through the following links:


Supported browsers
The ASP.NET Core Pivot Table works well with all modern web browsers, including Chrome, Firefox, Edge, Safari, and Opera.
Not sure how to create your first ASP.NET Pivot Table? Our tutorial videos and documentation can help.
I’d love to read it now140+ ASP.NET CORE UI CONTROLS
ALL CONTROLS
SMART COMPONENTS
GRIDS
DATA VISUALIZATION
FILE VIEWERS & EDITORS
DROPDOWNS
NAVIGATION
INPUTS
BUTTONS
NOTIFICATION
INTERACTIVE CHAT
Standalone UI SDKs
Integrate the DataGrid, Chart, Scheduler, Gantt, Rich Text Editor, File Manager, and Diagram UI components into applications to enable rich interaction and visualization, delivering a seamless user experience.
Document Solutions
Integrate the PDF Viewer, DOCX Editor, Spreadsheet Editor, and document-processing libraries into the ASP.NET Core applications to enable a smooth user experience.
Frequently Asked Questions
Why should you choose the Syncfusion ASP.NET Core Pivot Table?
High performance pivot engine and virtualization that help load large volumes of data quickly.
Support for both relational and OLAP data sources. The relational data source can use input data via JSON, RESTful services, OData services, WCF services, and more.
A grid and chart can be used to organize and summarize pivot data.
Pivot data is easily filtered, sorted, aggregated, and grouped.
Detailed or abstract data can be viewed using drill down or up.
Seamless interaction and editing capabilities.
Simple configuration and APIs.
- Support for all modern browsers.
- Touch-friendly and responsive UI.
Expansive learning resources such as demos and documentation to get started quickly with the control.
Where can I find the Syncfusion ASP.NET Core Pivot Table demo?
You can find our ASP.NET Core Pivot Table demo here.
What is the ASP.NET Core Pivot Table?
The ASP.NET Core Pivot Table is a powerful data control used to organize and summarize business data in a tabular form. It is designed for high performance and can handle large datasets efficiently.
How do I export the ASP.NET Core Pivot Table to Excel?
The ASP.NET Core Pivot Table control can be exported to Excel, CSV, and other file formats using built-in methods. You can easily export the pivot table content by calling the export method from the Syncfusion API.
Can I download and utilize the Syncfusion ASP.NET Core Pivot Table for free?
No, this is a commercial product and requires a paid license. However, a free community license is also available for companies and individuals whose organizations have less than $1 million USD in annual gross revenue, 5 or fewer developers, and 10 or fewer total employees.
How do I get started with the Syncfusion ASP.NET Core Pivot Table?
A good place to start would be our comprehensive getting started documentation.
How do I configure data for a ASP.NET Core Pivot Table?
To configure data for the ASP.NET Core Pivot Table, you need to bind your data source (e.g., SQL, JSON) to the Pivot Table control. Set data fields such as rows, columns, values, and filters using their Syncfusion API.
How can I implement drill-down functionality in the ASP.NET Core Pivot Table?
Drill-down functionality in the Syncfusion ASP.NET Core Pivot Table control is enabled by default based on its nested rows and columns. You can easily implement drill-down functionality by enabling this feature via the API or properties under e-datasourcesettings. You can also control the drill behavior using event handlers and settings in the component. Refer to this documentation for more information.
Our Customers Love Us
Having an excellent set of tools and a great support team, Syncfusion® reduces customers’ development time.Here are some of their experiences.

Great and flexible controls to build web applications
Controls meet specifications to develop web applications (ASP.NET MVC and Core in my case) and provide a lot of features to develop world-class software. There are options for other frameworks/platforms. Support is excellent which makes me feel very confident when facing trouble, they provide answers in 24 hours. Support team will make a big effort to solve your issues and they are ready for a phone call and to remotely connect to your PC.

Jorge M,

Founder and Software Architect, Small-Business
Great tool, saves alot of time, and great support
Syncfusion really makes it simple to implement features that would take a ton of time and effort to create. When you're building your site, the UI can take a ton of time away from building the core app. With Syncfusion's tools it reduces that effort significantly so you can get back to building the core elements.

Walter T,
Founder, Small-Business
See Real Success Stories
Developers around the world trust Syncfusion’s Essential Studio to simplify complex projects and speed up delivery. With a vast library of UI controls, powerful SDKs, and reliable support, Essential Studio helps teams build enterprise-ready applications with confidence.
Read Our Customer StoriesIndustry
Software development
75% Cost reduction
50% Faster development
Industry
Utilities (oil and gas)
450+ hours saved
Streamlined processes and hours of development effort saved.
Advanced, flexible features
Empowered users through robust and versatile functionality.
Industry
Software and technology
1000+ of hours saved
Accelerated development with enterprise-ready UI components.
Efficient file management
Streamlined workflows with document libraries without building them from scratch.
Industry
Software and technology
2 Years of delay avoided
Two years of delays prevented with proactive planning.
On-time delivery
Projects delivered on schedule using trusted controls.
Industry
IT services and IT consulting
Improved performance
Large datasets handled with easy customization and quick debugging.
Highly customizable
Plug-and-play controls with quick template integration.
Industry
Professional services
Instant access
Quick availability of features and resources.
Reduced dependencies
Fewer dependencies for faster development.
Rated by users across the globe
Syncfusion ASP.NET Core Pivot Table resources


UI Kits
 Figma download
Figma download
Awards
Greatness—it’s one thing to say you have it, but it means more when others recognize it. Syncfusion® is proud to hold the following industry awards.

