Chart of the Week: Creating a .NET MAUI Column Chart to Visualize the Corporate Investment in AI Saiyath Ali Fathima M March 27, 2024
Chart of the Week: Creating a .NET MAUI Fast Line Chart to Visualize the Arctic Sea Ice Extent Since 2000 Sneha Kumar March 21, 2024
Chart of the Week: Creating a WPF Bar Chart to Visualize the Homelands of America’s International Students Saiyath Ali Fathima M February 21, 2024
Chart of the Week: Creating a WPF Stacked Bar Chart to Visualize the Social Media Use of US Teens in 2023 Karthikeyan V February 7, 2024
Chart of the Week: Creating a WPF 3D Pie Chart to Display the Biggest Cash Crops in the U.S Saiyath Ali Fathima M February 8, 2024
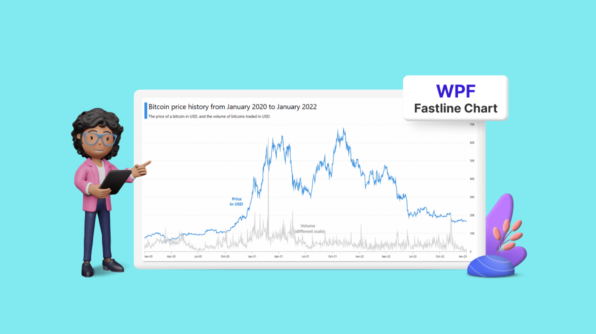
Chart of the Week: Creating a WPF Fast Line Chart for Cryptocurrency Trade Analysis Vimala Thirumalai Kumar November 22, 2023
Chart of the Week: Creating a WPF Column Chart for Countries with the Most Active Volcanoes Saiyath Ali Fathima M February 20, 2024
Chart of the Week: Creating a .NET MAUI Range Column Chart to Compare Average Temperature Variations in Rome Vimala Thirumalai Kumar January 26, 2024
Chart of the Week: Creating A Trend Line Using WPF Charts to Visualize Rapid Heating in North American Oceans Nanthini Mahalingam February 20, 2024
Chart of the Week: Creating a WinUI Spline Area Chart for Top Google Investing Searches in 2022 Nitheeshkumar Thangaraj August 18, 2023
Chart of the Week: Creating a WinUI 100% Stacked Column Chart for Global Distribution of Cloud Provider Data Centers Saiyath Ali Fathima M August 4, 2023