
Welcome to our Chart of the Week blog series!
In this blog, we’ll visualize the top Google search trends for investing using the Syncfusion WinUI Spline Area Chart. In an investment landscape in constant flux, staying attuned to these trends is important.
Such insights empower investors and analysts, offering a more profound comprehension of market dynamics. By diving into the search trends of 2022, one can unearth significant information on market sentiment, identify burgeoning investment opportunities, and gain perspective on trending financial matters.
Refer to the following image.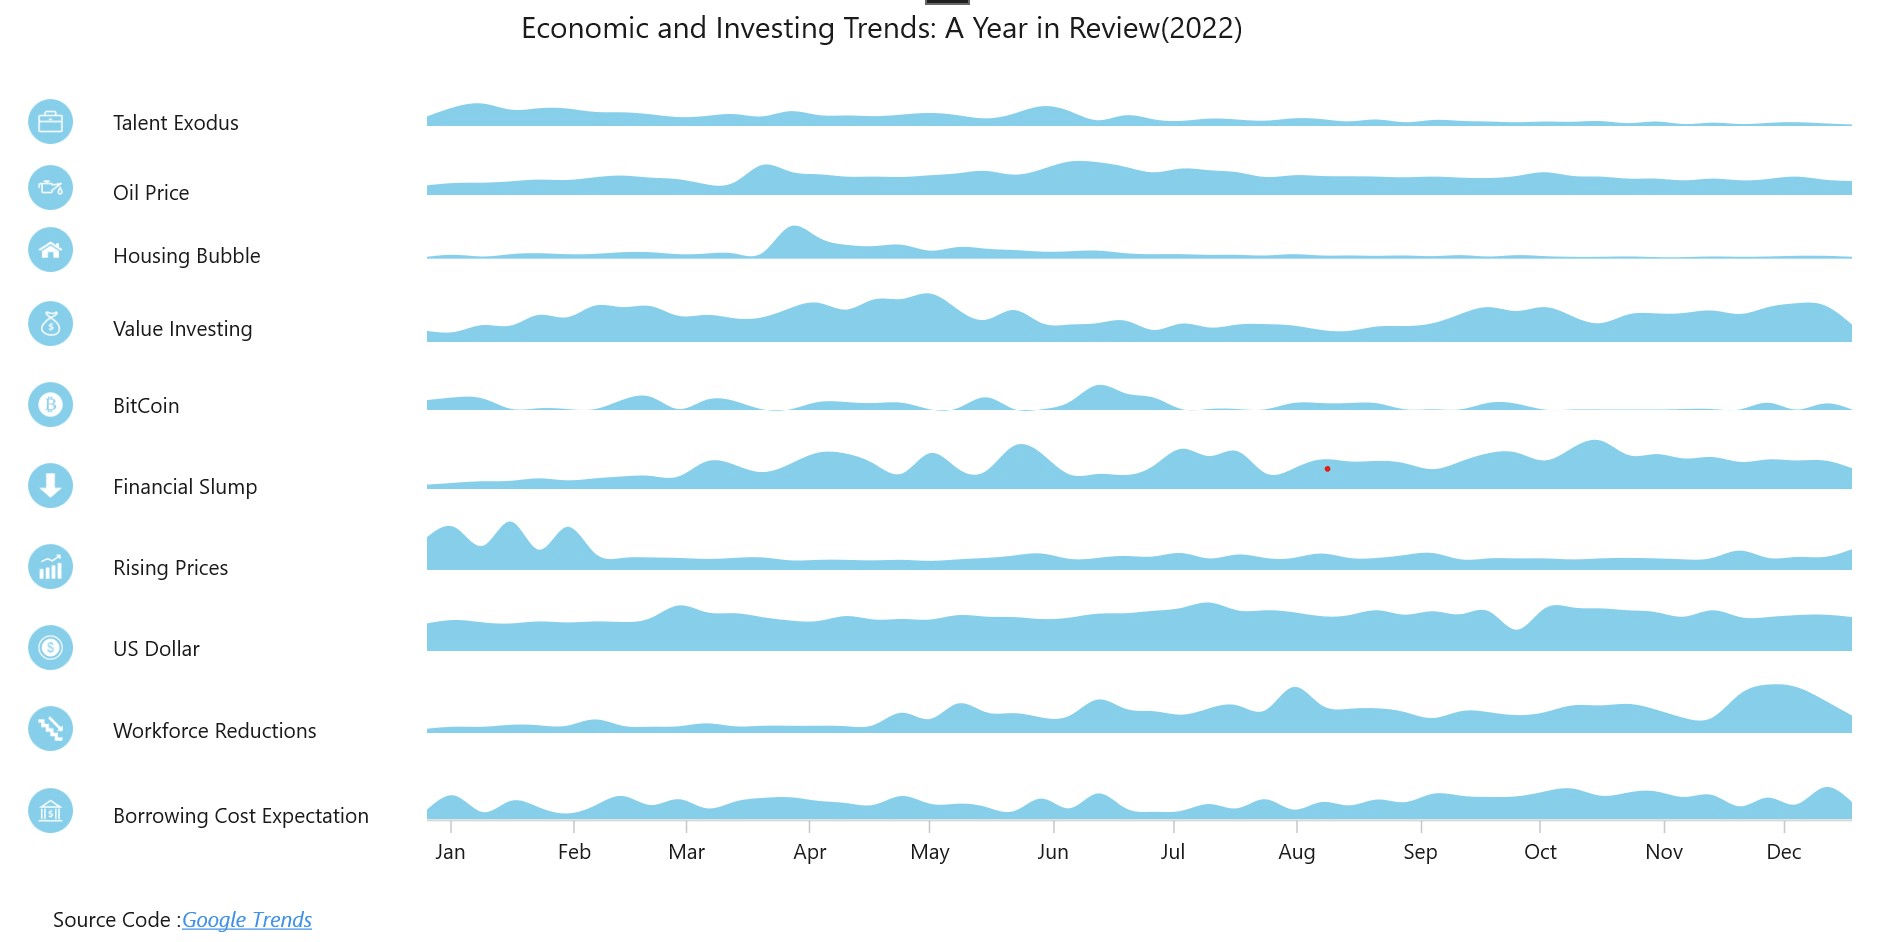
Let’s see the steps to visualize the top Google searches related to investing using the Syncfusion WinUI Spline Area Chart.
Step 1: Gathering the data
Before creating the chart, we need to gather the data on the top Google searches related to investing. For this demo, get the data from Jan. 2022 to Dec. 2022, which can be downloaded as a CSV file.
Step 2: Prepare the data for the chart
Create the GoogleSearchModel class to hold the data with Year and Value properties.
Refer to the following code example.
public class GoogleSearchModel
{
     public DateTime Year { get; set; }
     public double Value { get; set; }

     public GoogleSearchModel(DateTime year, double value)
     {
        Year = year;
        Value = value;
     }
}
Next, generate the top Google search data collection with the help of the GoogleSearchViewModel class and separate properties for each series.
Convert the CSV data to a collection using the ReadCSV method and store it in the collection property.
public class GoogleSearchViewModel : INotifyPropertyChanged
{
   private List<GoogleSearchModel> greatResignation;
   private List<GoogleSearchModel> oilPrice;
   private List<GoogleSearchModel> housingBubble;
   private List<GoogleSearchModel> valueInvesting;
   private List<GoogleSearchModel> bitCoin;
   private List<GoogleSearchModel> recession;
   private List<GoogleSearchModel> inflation;
   private List<GoogleSearchModel> uSDollar;
   private List<GoogleSearchModel> layoffs;
   private List<GoogleSearchModel> interestRate;

   public List<GoogleSearchModel> GreatResignation
   {
       get
       { return greatResignation; }
       set
       {
           greatResignation = value;
           NotifyPropertyChanged(nameof(GreatResignation));
       }
   }

   public List<GoogleSearchModel> OilPrice
   {
       get { return oilPrice; }
       set
       {
          oilPrice = value; NotifyPropertyChanged(nameof(OilPrice));
       }
   }

   public List<GoogleSearchModel> HousingBubble
   {
       get { return housingBubble; }
       set
       {
          housingBubble = value; NotifyPropertyChanged(nameof(HousingBubble));
       }
   }

   public List<GoogleSearchModel> ValueInvesting
   {
        get { return valueInvesting; }
        set
        {
           valueInvesting = value; NotifyPropertyChanged(nameof(ValueInvesting));
        }
   }

   public List<GoogleSearchModel> BitCoin
   {
        get { return bitCoin; }
        set
        {
           bitCoin = value; NotifyPropertyChanged(nameof(BitCoin));
        }
   }

   public List<GoogleSearchModel> Recession
   {
        get { return recession; }
        set
        {
           recession = value; NotifyPropertyChanged(nameof(Recession));
        }
   }

   public List<GoogleSearchModel> Inflation
   {
        get { return inflation; }
        set
        {
           inflation = value; NotifyPropertyChanged(nameof(Inflation));
        }
   }

   public List<GoogleSearchModel> USDollar
   {
        get { return uSDollar; }
        set
        {
            uSDollar = value; NotifyPropertyChanged(nameof(USDollar));
        }
   }

   public List<GoogleSearchModel> Layoffs
   {
        get { return layoffs; }
        set
        {
            layoffs = value; NotifyPropertyChanged(nameof(Layoffs));
        }
   }

   public List<GoogleSearchModel> InterestRate
   {
        get { return interestRate; }
        set
        {
             interestRate = value; NotifyPropertyChanged(nameof(InterestRate));
        }
   }

public GoogleSearchViewModel()
   {
       GreatResignation = new List<GoogleSearchModel>(ReadCSV("SplineAreaSample.Resource.multiTimeline.csv"));
       OilPrice = new List<GoogleSearchModel>(ReadCSV("SplineAreaSample.Resource.OilPrice.csv"));
       HousingBubble = new List<GoogleSearchModel>(ReadCSV("SplineAreaSample.Resource.HousingBubble.csv"));
       ValueInvesting = new List<GoogleSearchModel>(ReadCSV("SplineAreaSample.Resource.ValueInvsesting.csv"));
       BitCoin = new List<GoogleSearchModel>(ReadCSV("SplineAreaSample.Resource.BitCoin.csv"));
       Recession = new List<GoogleSearchModel>(ReadCSV("SplineAreaSample.Resource.Recession.csv"));
       Inflation = new List<GoogleSearchModel>(ReadCSV("SplineAreaSample.Resource.Inflation.csv"));
       USDollar = new List<GoogleSearchModel>(ReadCSV("SplineAreaSample.Resource.USDollar.csv"));
       Layoffs = new List<GoogleSearchModel>(ReadCSV("SplineAreaSample.Resource.Layoffs.csv"));
       InterestRate = new List<GoogleSearchModel>(ReadCSV("SplineAreaSample.Resource.InterestRate.csv"));
   }

private IEnumerable<GoogleSearchModel> ReadCSV(string resourceStream)
   {
       Assembly executingAssembly = typeof(App).GetTypeInfo().Assembly;
       Stream inputStream = executingAssembly.GetManifestResourceStream(resourceStream);

       string? line;
       List<string> lines = new List<string>();
       using StreamReader reader = new StreamReader(inputStream);
       while ((line = reader.ReadLine()) != null)
       {
          lines.Add(line);
       }

       return lines.Select(line =>
       {
          string[] data = line.Split(',');
          DateTime date = DateTime.ParseExact(data[0], "yyyy-MM-dd", CultureInfo.InvariantCulture);
          return new GoogleSearchModel((date), Convert.ToDouble(data[1]));
       });
   }
   public event PropertyChangedEventHandler PropertyChanged;

   private void NotifyPropertyChanged([CallerMemberName] string propertyName = "")
   {
       PropertyChanged?.Invoke(this, new PropertyChangedEventArgs(propertyName));
   }
}
Step 3: Configuring the Syncfusion WinUI Cartesian charts control
Configure the Syncfusion WinUI Cartesian charts control using this documentation.
Refer to the following code example.
<chart:SfCartesianChart>
 <chart:SfCartesianChart.XAxes>
  <Chart:CategoryAxis/>
 </chart:SfCartesianChart.XAxes>

 <chart:SfCartesianChart.YAxes>
  <Chart:NumericalAxis/>
 </chart:SfCartesianChart.YAxes>

</chart:SfCartesianChart>
Step 4: Binding data to WinUI Spline Area Chart
Use the Syncfusion SplineAreaSeries class to bind the data to the chart.
Refer to the following code example.
<Chart:SplineAreaSeries
       ItemsSource="{Binding HousingBubble}"
       XBindingPath="Year"
       YBindingPath="Value">
</Chart:SplineAreaSeries>
In this example, we’ve bound the chart to the GoogleSearchViewModel property containing our Google search data.
Step 5: Customizing the chart appearance
We can customize the chart’s appearance by hiding the x- and y-axes in the chart axis element, changing the spline area color, using style to avoid repeating code, and adding titles to the charts.
Split the view into three columns and display the chart title.
<Grid.ColumnDefinitions>
 <ColumnDefinition Width="0.5*"></ColumnDefinition>
 <ColumnDefinition Width="1.5*"></ColumnDefinition>
 <ColumnDefinition Width="7.5*"></ColumnDefinition>
</Grid.ColumnDefinitions>

<TextBlock Text="Economic and Investing Trends: A Year in Review(2022)" Grid.Column="2" Grid.Row="0" FontSize="20" HorizontalTextAlignment="Center"></TextBlock>
Adjust the axis settings and hide the grid lines and the x- and y-axes to achieve the view as shown in the following code example.
<chart:SfCartesianChart.XAxes>
 <chart:DateTimeAxis ShowMajorGridLines="False" ShowMinorGridLines="False" Visibility="Collapsed" >
 </Chart:DateTimeAxis>
</chart:SfCartesianChart.XAxes>

<chart:SfCartesianChart.YAxes>
 <chart:NumericalAxis ShowMajorGridLines="False" ShowMinorGridLines="False" Visibility="Collapsed"></chart:NumericalAxis>
</chart:SfCartesianChart.YAxes>
Configure the images for the top Google search companies in the first column. The following shows the code example for the Talent Exodus series. Configure the chart for the other series in the same way.
<ImageIcon Source="Image/Talent Exodus.png" Grid.Column="0" Grid.Row="3" Margin="20,-25,0,0"></ImageIcon>
Now, configure the company names in the second column, as shown in the following code example.
<TextBlock Text="Talent ExodusGrid.Column="1" Grid.Row="1" Margin="20,30,0,0"></TextBlock>
We can set the margin, height, width, color, and more for each view separately. However, to avoid repetition, let’s use the style shown in the following code example.
<Grid.Resources>
 <ResourceDictionary>
  <Style TargetType="chart:DateTimeAxis">
   <Setter Property="ShowMajorGridLines" Value="False"></Setter>
   <Setter Property="ShowMinorGridLines" Value="False"></Setter>
   <Setter Property="Visibility" Value="Collapsed"></Setter>
  </Style>
  <Style TargetType="chart:NumericalAxis">
   <Setter Property="ShowMajorGridLines" Value="False"></Setter>
   <Setter Property="ShowMinorGridLines" Value="False"></Setter>
   <Setter Property="Visibility" Value="Collapsed"></Setter>
  </Style>
  <Style TargetType="chart:SfCartesianChart">
   <Setter Property="Height" Value="30"></Setter>
   <Setter Property="Width" Value="950"></Setter>
   <Setter Property="Margin" Value="0,-50,0,0"></Setter>
   <Setter Property="VerticalAlignment" Value="Center"></Setter>
  </Style>
  <Style TargetType="chart:SplineAreaSeries">
   <Setter Property="Fill" Value="#87CEEB"></Setter>
   <Setter Property="XBindingPath" Value="Year"></Setter>
   <Setter Property="YBindingPath" Value="Value"></Setter>
  </Style>
  <Style TargetType="ImageIcon">
   <Setter Property="Width" Value="30"></Setter>
   <Setter Property="Margin" Value="20,-35,0,0"></Setter>
   <Setter Property="VerticalAlignment" Value="Center"></Setter>
  </Style>
  <Style TargetType="TextBlock">
   <Setter Property="Margin" Value="20,-35,0,0"></Setter>
   <Setter Property="VerticalAlignment" Value="Center"></Setter>
  </Style>
 </ResourceDictionary>
</Grid.Resources>
Finally, configure the Spline Area Chart for each series in the third column.
<chart:SfCartesianChart Grid.Column="3" Grid.Row="1" Margin="0,-5,0,0">
 <chart:SfCartesianChart.XAxes>
  <Chart:DateTimeAxis/>
 </chart:SfCartesianChart.XAxes>
 <chart:SfCartesianChart.YAxes>
  <Chart:NumericalAxis/>
 </chart:SfCartesianChart.YAxes>
 <chart:SplineAreaSeries ItemsSource="{Binding  Talent Exdous"/>
</chart:SfCartesianChart>
After executing the previous code examples, we’ll get output like in the following image.
GitHub Reference
For more information, refer to the demo on GitHub.
Conclusion
Thanks for reading! In this blog, we explored the top Google searches for the latest investment trends in 2022 using the Syncfusion WinUI Spline Area Chart. We hope that this information will assist you in making similar, useful spline area charts. Try out the steps discussed in this blog, and leave your feedback in the comments section below!
You can also contact us via our support forum, support portal, or feedback portal. We are always eager to help you!
Related blogs
- Chart of the Week: Creating a WinUI 100% Stacked Column Chart for Global Distribution of Cloud Provider Data Centers
- Personalize Your WinUI DataGrid: Quick and Simple Customization Techniques
- Introducing the New WinUI AvatarView Control
- How to Synchronize Outlook Calendar Events with Syncfusion WinUI Scheduler
 No spam, just valuable updates.