
Welcome to our special milestone blog! We have reached our 25th blog in the “Chart of the Week” series, and it’s time to celebrate the journey. Over the past blogs, we’ve explored various use cases, showcasing the power and versatility of the Syncfusion Charts controls across various platforms.
In this consolidated blog, we’ll look back at these 25 charting solutions that have helped us visualize and understand data in new and exciting ways.
Top 5 charting solutions
First, let’s spotlight the top 5 articles that garnered the most attention and positive feedback, both from the search engines and our readers!
1. Creating a .NET MAUI Column Chart to Visualize Yearly Box Office Data
 The chart in this blog helps analyze box office performance and revenue trends, which is valuable for the entertainment industry. It showcases a column chart customized with a new appearance using a corner radius.
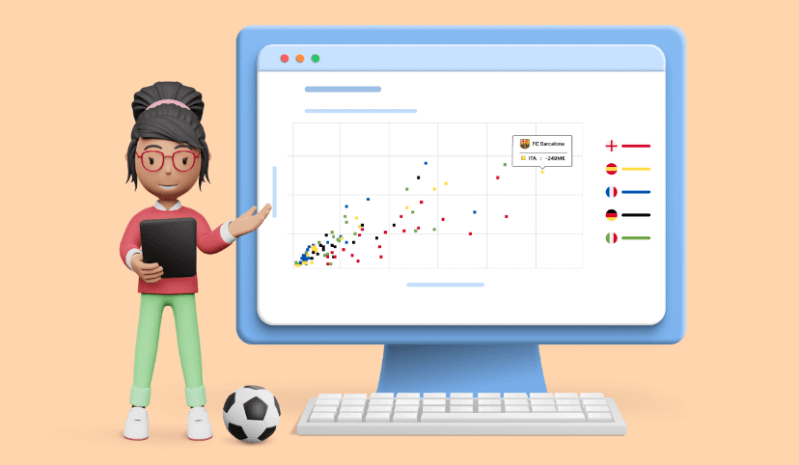
This blog shows how to analyze transfer spending in sports using scatter charts. It helps people working in sports management.
3. Creating a .NET MAUI Waterfall Chart to Track Monthly Sales

This blog showcases how to track and understand sales performance and fluctuations on a monthly basis with the waterfall chart and its data label feature.
4. Creating a .NET MAUI Pyramid Chart of Global Wealth Distribution
 This blog helps visualize wealth distribution data with a pyramid chart. It can be a valuable tool for economic and social analysis.
5. Creating a WPF Range Column Chart to Visualize ChatGPT’s Performance in Competitive Exams
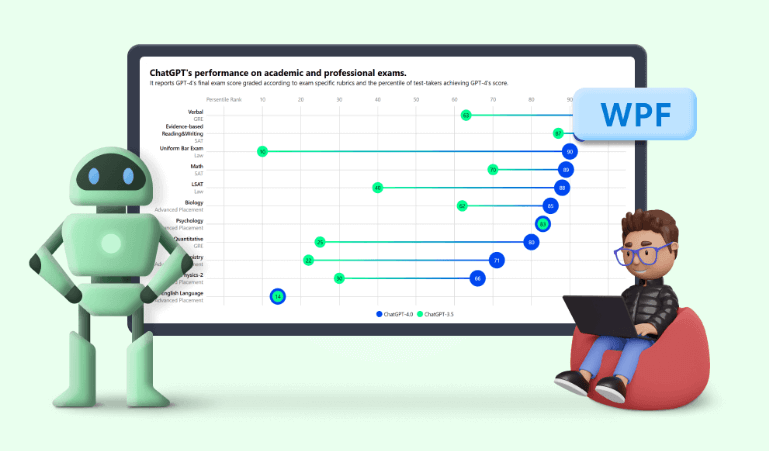 This blog explains how to visualize the performance of ChatGPT’s versions 3.5 and 4 on academic and professional exams for sales and performance analysis.
Categorizing the use cases
Let’s make it easier. We have categorized the rest of the blogs based on their type of use case, as seen in the following image. This blog will help you cross-check our posts or discover new blogs if you missed any. 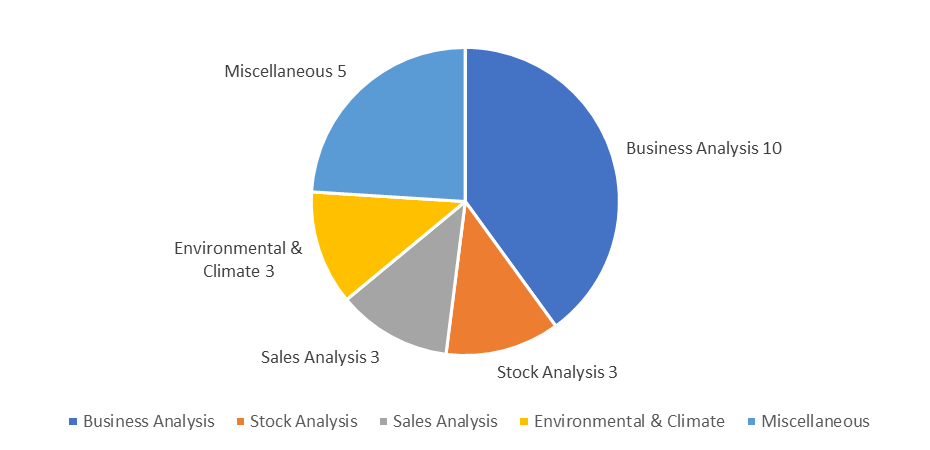
Business analysis

1. Creating a .NET MAUI Inversed Column Chart to Visualize Meta Reality Labs’s Yearly Operating Loss
Assess financial data and operating losses for Meta Reality Labs with the stunning inversed column chart.
2. Creating a .NET MAUI Pie Chart to Illustrate U.S. Methane Emissions in 2021
Visualize environmental data using the versatile features of pie charts for sustainability analysis.
Analyze revenue details from health and wellness data. It is beneficial for app developers to create stunning charts to showcase data with multiple series support.
4. Creating .NET MAUI Area Chart for U.S. Tech Companies Adopting Dual-Class Voting Structures
Dive into corporate governance analysis by exploring voting structures in tech companies using an area chart with side-by-side placement.
5. Creating a .NET MAUI Horizontal Bar Chart to Compare Grocery Prices Between Two Countries
Compare pricing data for retail and consumer goods analysis using multiple horizontal bar charts in a side-by-side appearance.
6. Creating a WPF Doughnut Chart for the Top Rice-Exporting Countries
Visualize data related to the top rice-exporting countries, which is valuable for business and trade analysis.
7. Creating a Pareto Chart Using .NET MAUI Charts to Identify Key Customer Complaints
This article uses a Pareto chart to identify key customer complaints.
Stock analysis
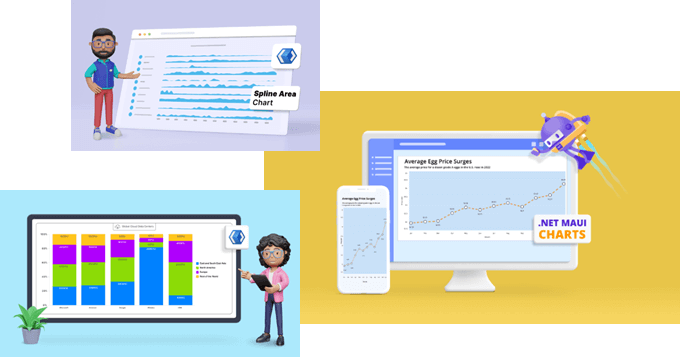
1. Create a Line Chart to Visualize the Surge in U.S. Egg Prices
Analyze price trends with the attractive dotted line chart, a crucial feature for stock and commodities analysis.
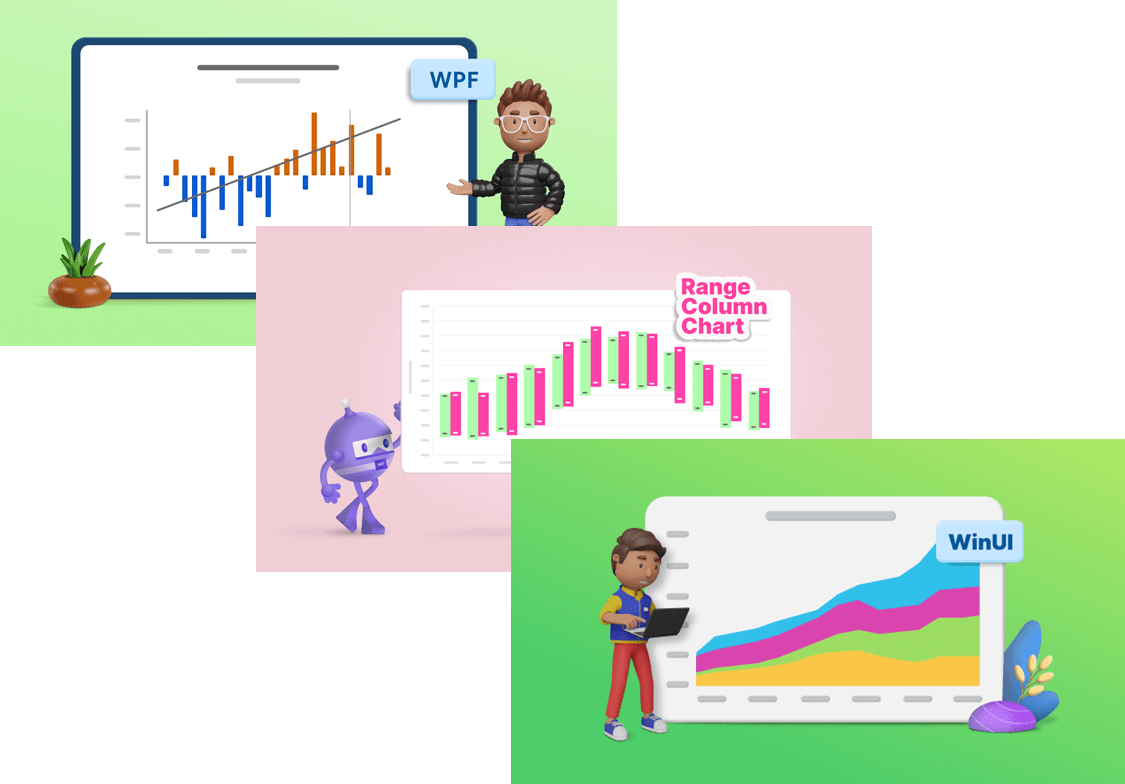
2. Creating a WinUI 100% Stacked Column Chart for Global Distribution of Cloud Provider Data Centers
Using a 100% stacked column chart, this blog shows how to visualize data center distribution, which is valuable for technology and cloud service stock analysis.
3. Creating a WinUI Spline Area Chart for Top Google Investing Searches in 2022
Track investment-related search trends, a key element for stock market and investment analysis.
Sales analysis
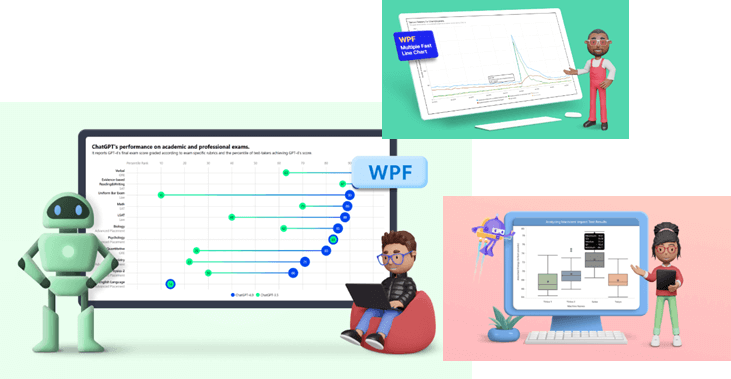
1. Creating a .NET MAUI Box and Whisker Chart for Machine Impact Test Analysis
Use interactive features to visualize test data for quality assurance and product sales analysis in a box and whisker chart.
2. Creating a WPF Multiple Fast Line Chart to Display COVID-19’s Impact on U.S. Unemployment
Visualize U.S. unemployment data during the pandemic. We can analyze the economy using a fast line chart with tooltip interaction.
Environmental and climate analysis
1. Creating a Trend Line Using WPF Charts to Visualize Rapid Heating in North American Oceans
Visualize climate data based on past and future trends. See how to use the trend line feature for environmental and climate analysis.
2. Creating a .NET MAUI Range Column Chart to Compare Average Temperature Variations in Rome
Showcase temperature variations within a time period and how temperature varies from high to low.
3. Creating a WinUI Stacked Area Chart to Visualize U.S. Primary Energy Consumption
Visualize energy consumption data using a stacked area chart.
Miscellaneous

1. Creating a .NET MAUI Error Bar Chart to Visualize the Thermal Expansion of Materials
Visualize the mean value of materials’ thermal expansion using an error bar chart. The chart helps analyze materials for scientific purposes.
2. Creating a Doughnut Chart for the World’s Top Coffee-Producing Countries
Visualize coffee production data for various coffee-producing countries with this doughnut chart.
3. Creating a Radial Bar Chart for Most and Least Powerful Passports in 2023
Use radial bar charts to visualize data on passport power rankings. This is potentially useful for travel and immigration analysis.
4. Creating a Column Chart for Countries with the Most Active Volcanoes
Visualize geological data using a column chart, which is valuable for geology and natural disaster analysis.
5. Creating a Tornado Chart for Petrol and Diesel Price Comparison
Compare energy prices for diesel and petrol (unleaded gas) in the U.K. using a tornado chart. Charts like these are a good choice for this kind of financial analysis.
Conclusion
Thanks for reading! We hope you’ve found our blog series enlightening and engaging. The uniformity in appearance and functionality of Syncfusion Charts controls across various platforms underscores their dependability for all your charting requirements.
For our existing customers, the latest version of Essential Studio is available for download on the License and Downloads page. If you’re new to Syncfusion, we invite you to explore our extensive features with a 30-day free trial.
We’re committed to supporting you every step of the way. Whether you have inquiries, require assistance, or wish to share feedback, feel free to connect with us via our support forum, support portal, or feedback portal. We’re always on standby to assist you.
Keep an eye out for our forthcoming blog series as we delve deeper into the boundless potential and insights offered by Syncfusion Charts controls across a multitude of domains and industries.


