
The Syncfusion Flutter Charts widget was first made available for public use in July, and we got overwhelming positive feedback on it from users. We also received requests for the support of many other chart types.
We processed these requests and handpicked seven more chart types to make available with our 2019 Volume 3 release. In this blog, we will quickly view the new chart types implemented, along with some new features.
New chart types
As stated in the introduction, we have extended the Syncfusion Flutter Charts widget to support seven more chart types:
- Stacked column chart
- Stacked bar chart
- Stacked line chart
- Stacked area chart
- Range column chart
- Pyramid chart
- Funnel chart
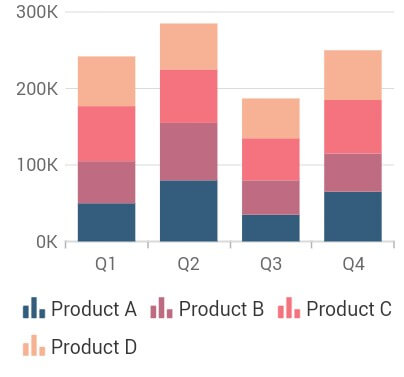
Stacked column chart
The stacked column chart allows you to plot data points on top of each other in vertical bars to allow part-to-whole comparisons. The following code illustrates how to render the stacked column chart.
SfCartesianChart(
  series: <ChartSeries<_ChartData, String>>[
    StackedColumnSeries<_ChartData, String>(
      dataSource: chartData,
      xValueMapper: (_ChartData sales, _) => sales.x,
      yValueMapper: (_ChartData sales, _) => sales.y1,
      name: 'Product A'
    ),
    // Add more series.
  ]
)
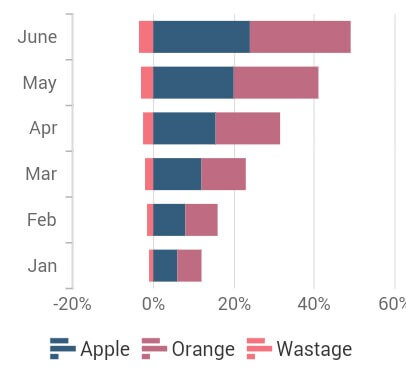
Stacked bar chart
The stacked bar chart is similar to the stacked column chart, as it allows you to plot data points on top of each other, but in horizontal bars. The following code illustrates how to render the stacked bar chart.
SfCartesianChart(
  series: <ChartSeries<_ChartData, String>>[
    StackedBarSeries<_ChartData, String>(
      dataSource: chartData,
      xValueMapper: (_ChartData sales, _) => sales.x,
      yValueMapper: (_ChartData sales, _) => sales.y1,
      name: 'Apple'
    ),
    // Add more series.
  ]
)
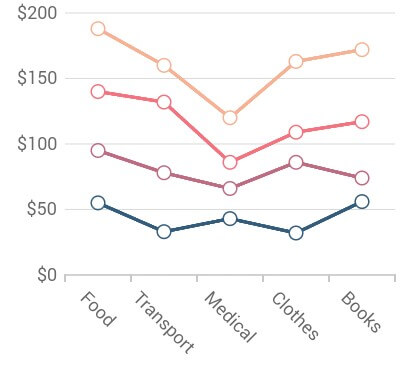
Stacked line chart
The stacked line chart is similar to a line chart, but the data points are stacked on top of each other. The following code illustrates how to render the stacked line chart.
SfCartesianChart(
  series: <ChartSeries<_ChartData, String>>[
    StackedLineSeries<_ChartData, String>(
      dataSource: chartData,
      xValueMapper: (_ChartData sales, _) => sales.x,
      yValueMapper: (_ChartData sales, _) => sales.y1,
      name: 'Product A'
    ),
    // Add more series.
  ]
)
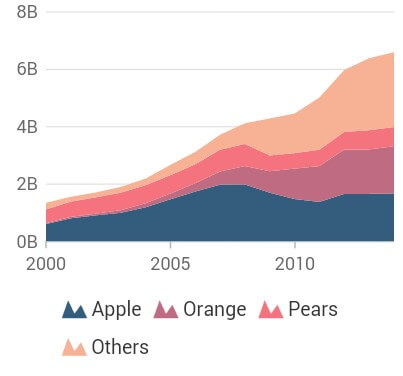
Stacked area chart
The stacked area chart is like an area chart, but the data points are stacked on top of each other. The following code illustrates how to render the stacked area chart.
SfCartesianChart(
  series: <ChartSeries<_ChartData, String>>[
    StackedAreaSeries<_ChartData, String>(
      dataSource: chartData,
      xValueMapper: (_ChartData sales, _) => sales.x,
      yValueMapper: (_ChartData sales, _) => sales.y1,
      name: 'Product A'
    ),
    // Add more series.
  ]
)
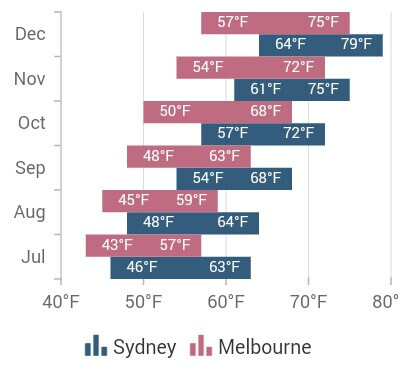
Range column chart
The range column chart is like a column chart, but the bars will start from the specified minimum value, instead of 0. The following code illustrates how to render the range column chart.
SfCartesianChart(
  series: <ChartSeries<_ChartData, String>>[
    RangeColumnSeries<_ChartData, String>(
      dataSource: chartData,
      xValueMapper: (_ChartData sales, _) => sales.x,
      highValueMapper: (_ChartData sales, _) => sales.high,
      lowValueMapper: (_ChartData sales, _) => sales.low,
      name: 'Product A'
    ),
    // Add more series.
  ]
)
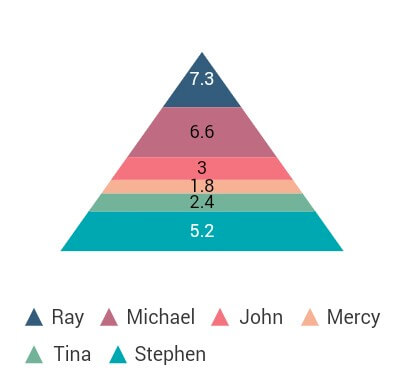
Pyramid chart
The pyramid chart represents hierarchies visually in a pyramid-like structure that shows proportions of the total value. The following code illustrates how to render the pyramid chart.
SfPyramidChart(
  series: PyramidSeries<_ChartData, String>(
      dataSource: chartData,
      xValueMapper: (_ChartData sales, _) => sales.x,
      yValueMapper: (_ChartData sales, _) => sales.y
  )
)
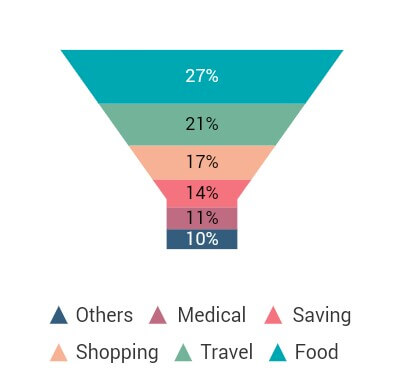
Funnel chart
The funnel chart plots the streamlined data to show various stages in a process. The following code illustrates how to render the funnel chart.
SfFunnelChart(
  series: FunnelSeries<_ChartData, String>(
      dataSource: chartData,
      xValueMapper: (_ChartData sales, _) => sales.x,
      yValueMapper: (_ChartData sales, _) => sales.y
    )
)
New features
Logarithmic axis
Previously, Syncfusion Flutter Charts provided support for three types of axes, namely numeric, category, and date-time. Now it has been extended to support logarithmic axes, too, to plot the data points on a logarithmic scale.
SfCartesianChart(
  primaryYAxis: LogarithmicAxis(
    logBase: 10
  )
)
Axis crossing
Support to move the position of the axis has been provided. This is applicable for both vertical and horizontal axis. The axis labels can be placed either near to the axis line or outside the plot area.
SfCartesianChart(
  primaryXAxis: NumericAxis(
    crossesAt: 0
  )
)
Plot bands
Plot bands are also known as strip lines, which are used to mark a specific range in an axis with different colors. Also, you can add desired text to the plot bands.
SfCartesianChart(
  primaryXAxis: CategoryAxis(
    plotBands: <PlotBand>[
      PlotBand(
        start: 0,
        end: 2,
        text: 'Winter'
      ),
      // More plot bands.
    ]
  )
)
Dynamic update animation
This is another interesting feature. On changing the data source or updating the data, the data points will be transformed with fluid animation from the old values to the new values. No new API is required for this and it will work if the value for animationDuration is specified in the series.
Licensing
To use the Syncfusion Flutter widgets, it is mandatory to have a valid Syncfusion license. You may have either a Syncfusion commercial license or the Syncfusion Community License. For more details, please check the LICENSE file. You should pass your key to the registerLicense method in the main method of your project. We have changed the charts package version from 1.0.0-beta.5 to 17.3.14 to align it to all other platform versions in Essential Studio®.
void main() {
  // Register your license key here.
  SyncfusionLicense.registerLicense(null);
  return runApp(ChartApp());
}
Conclusion
I hope you are excited to use these new features in your applications. For existing customers, the new version is available for download from the license and downloads page or you can get the packages directly from pub.dev. If you are not yet a customer, you can try our 30-day free trial to check out these new features. Try our samples from this GitHub location.
Also, if you wish to send us feedback or would like to submit any questions, please feel free to post them in the comments section of this blog post. You can also contact us through our support forum, feedback portal, or Direct-Trac support system.


 No spam, just valuable updates.
Comments (2)
The funnel chart is similar to the pyramid chart, which also stacks data points, and it resembles the appearance of a funnel.
Hi GRAMHUM,
Yes. The functionalities of the pyramid and funnel are almost similar to each other and only the appearance differs. Pyramid chart renders the data points from top to bottom, whereas the funnel chart renders from bottom to top. Please refer the below links for more details about those chart types.
Pyramid –
UG – https://help.syncfusion.com/flutter/pyramid-chart/pyramid-customization
FT – https://www.syncfusion.com/flutter-widgets/flutter-charts/chart-types/pyramid-chart
Funnel –
UG – https://help.syncfusion.com/flutter/funnel-chart/funnel-customization
FT – https://www.syncfusion.com/flutter-widgets/flutter-charts/chart-types/funnel-chart
Thanks,
Jayavigneshwaran