Stacked Column Chart in Essential Studio® Flutter
Overview
The Flutter Stacked Column Chart visualizes the data with y-values stacked over one another in the series order. It shows the relationship between individual values to the total sum of the points. You can create beautiful, animated, real-time and high-performance stacked column chart that also supports the interactive features such as zooming and panning, trackball, crosshair, tooltip and selection.

Key features
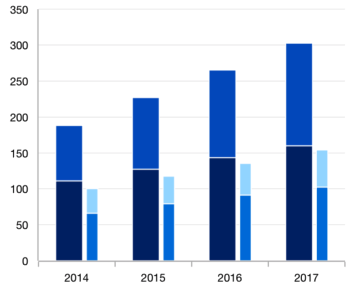
Stacking group
Group a series with another series using the group name in the Flutter Stacked Column Chart. Group the series with different stacking name separately.
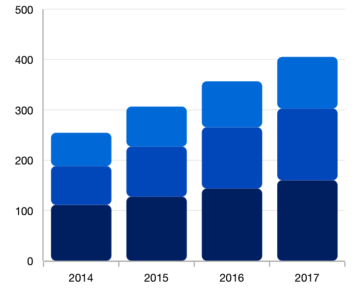
Rounded corners
Modernize the UI by applying the rounded corners to the Flutter Stacked Column Chart.
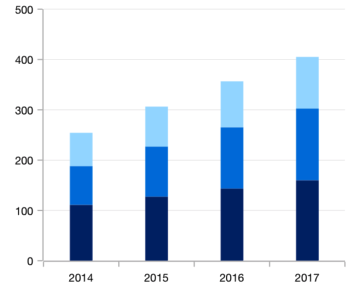
Spacing and width
The stacking column chart provides an option to customize the spacing between two rectangle.
Learning resources


Flutter Stacked Column Chart User Guide
Learn available options to customize the Flutter Stacked Column Chart.
