Stacked Area Chart in Essential Studio® Flutter
Overview
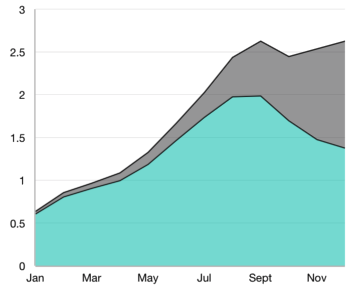
The Flutter Stacked Area Chart visualizes data with y-values stacked one over another in a series order. It shows the relationship between individual values to the total sum of points. You can create beautiful, animated, real-time and high-performance stacked area chart that also supports the interactive features such as zooming and panning, trackball, crosshair, tooltip and selection.

Key features

Vertical rendering
Rotate the Flutter Stacked Area Chart to plot data in the vertical direction and view it from a different perspective.

Empty point
Empty or null data points are elegantly handled in the stacked area chart.
Customization
Customize the color and border of the Flutter Stacked Area Chart using built-in APIs to make it visually unique.
Learning resources


Flutter Stacked Area Chart User Guide
Learn available options to customize the Flutter Stacked Area Chart.
