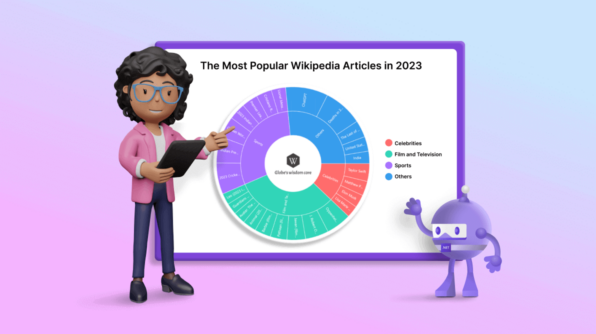
Chart of the Week: Creating a .NET MAUI Sunburst Chart to Visualize the Most Popular Wikipedia Articles Saiyath Ali Fathima M May 14, 2024
Chart of the Week: Creating a .NET MAUI Column Chart to Visualize the Corporate Investment in AI Saiyath Ali Fathima M May 14, 2024
Chart of the Week: Create a .NET MAUI Column Chart to Visualize which Milk Is the Most Sustainable Saiyath Ali Fathima M May 14, 2024
Chart of the Week: Creating a WPF Bar Chart to Visualize the Homelands of America’s International Students Saiyath Ali Fathima M May 14, 2024
Chart of the Week: Creating a .NET MAUI Bar Chart to Visualize Type 1 Diabetes Prevalence Saiyath Ali Fathima M May 14, 2024
Chart of the Week: Creating a WPF 3D Pie Chart to Display the Biggest Cash Crops in the U.S Saiyath Ali Fathima M May 14, 2024
Chart of the Week: Creating a WPF Column Chart for Countries with the Most Active Volcanoes Saiyath Ali Fathima M May 14, 2024
Chart of the Week: Creating a WPF Doughnut Chart for the Top Rice-Exporting Countries Saiyath Ali Fathima M May 14, 2024
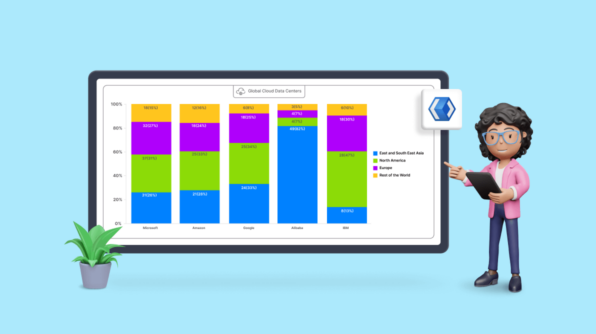
Chart of the Week: Creating a WinUI 100% Stacked Column Chart for Global Distribution of Cloud Provider Data Centers Saiyath Ali Fathima M May 14, 2024
Chart of the Week: Creating a .NET MAUI Pyramid Chart of Global Wealth Distribution Saiyath Ali Fathima M May 14, 2024
Chart of the Week: Creating .NET MAUI Area Chart for US Tech Companies Adopting Dual-Class Voting Structures Saiyath Ali Fathima M May 14, 2024