
We at Syncfusion are very happy to announce the inclusion of the new .NET MAUI Maps control in the 2022 Volume 2 release.
The .NET MAUI Maps control is a powerful data visualization component that displays statistical information for a geographical area. It has highly interactive and customizable features such as selection, tooltips, legends, markers, bubbles, and color mapping. You can generate and view important data such as population density, weather forecasts, geographical features, political boundaries, elections, and routes.
Users can view not only a geographical map, but also view custom shapes such as a floorplan of a room or building, or a venue’s seating layout using the .NET MAUI Maps control.
Note: The Syncfusion .NET MAUI Maps control is implemented to read input shape data and draw the right shapes. Syncfusion does not support shape designing or shapefile generation. For this purpose, we recommend using online map providers.
Let’s see the features of the Maps control and how to integrate it into your .NET MAUI application.
Shape layer
We can use the shape layer to represent the world map, a specific country or region, or a custom shape such as a building. The shapes will be rendered from input files such as GeoJSON (.json) or Shapefile (.shp).
You can load shape files from the following sources:
- FromFile: Returns a MapSource that reads a shape source from a local file.
- FromUri: Returns a MapSource that downloads and reads a shape source from a specified URI.
- FromResource: Returns a MapSource that reads a shape source file embedded in an assembly.
- FromStream: Returns a MapSource that reads a shape source from a stream that supplies source data.
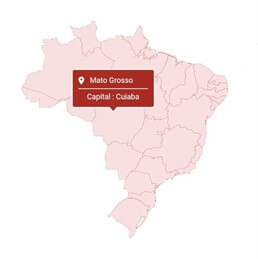
Data labels
Data labels provide users with information such as identification, notification, warning, environmental advice, and other general information about the shapes or regions. In short, they are simply text shown over the shapes. Data labels will smartly arrange themselves when they exceed their region bounds.
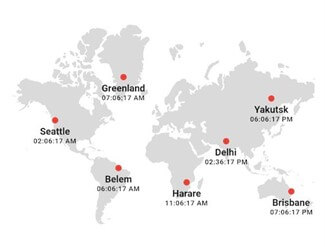
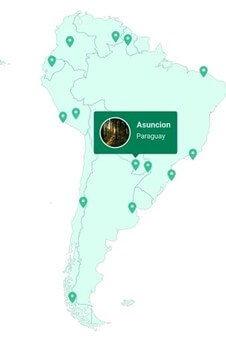
Markers
Markers are used to denote specific locations with exact latitudes and longitudes (geocoordinates) on maps. A marker, by default, uses a standard shape such as a circle, diamond, square, or triangle. You can customize the markers to display any custom content or image instead of these predefined shapes.
You can also use the markers’ tap or click interaction for custom functionalities such as navigation or a custom info window.
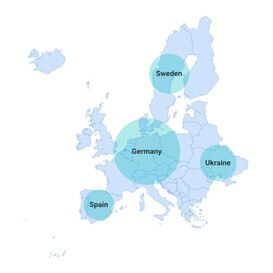
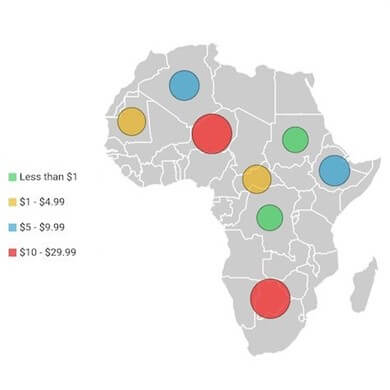
Bubbles
Bubbles are yet another data visualization medium. They summarize your input data. You can add information such as population density and the number of users to map regions. You can render them in different colors and sizes based on the data of their respective regions.
Color customization
You can customize the colors of the bubbles and their transparency based on the data of the regions.
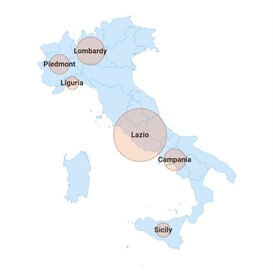
Size customization
You can plot the bubbles in different sizes based on the data to enhance their readability.
Legend
A map may have many different symbols, making it more difficult for users to understand each one. That is where legends come in handy.
A legend is a glossary of the symbols used in a map that conveys clear information about the data plotted. With this, you can display information about the shapes or bubbles plotted.
Shape legend
You can show legends for data represented by shapes.
Bubble legend
Show legends for data represented by bubbles.
Position
Also, you can move the legend to any side of a map.
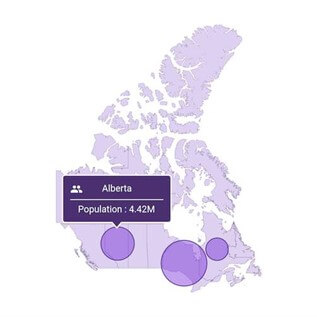
Tooltip
Add tooltips to show additional information about shapes, bubbles, and markers when you tap, click, or hover over (on desktop) them.
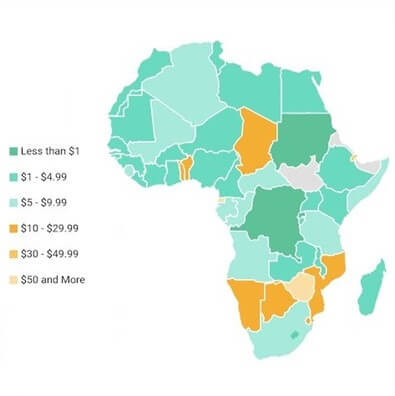
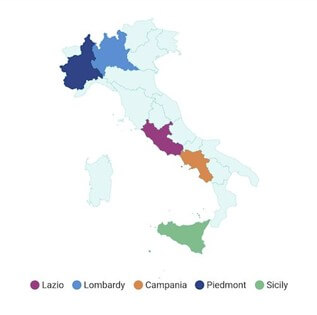
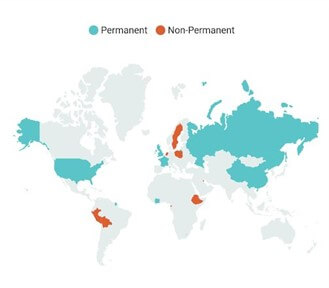
Color mapping
You can categorize a shape or bubble on a map by customizing its color based on its data. The .NET MAUI Maps control supports two types of color mapping:
Equal color mapping
Apply a specific color to a shape based on its data. For example, apply colors to countries based on their organization membership.
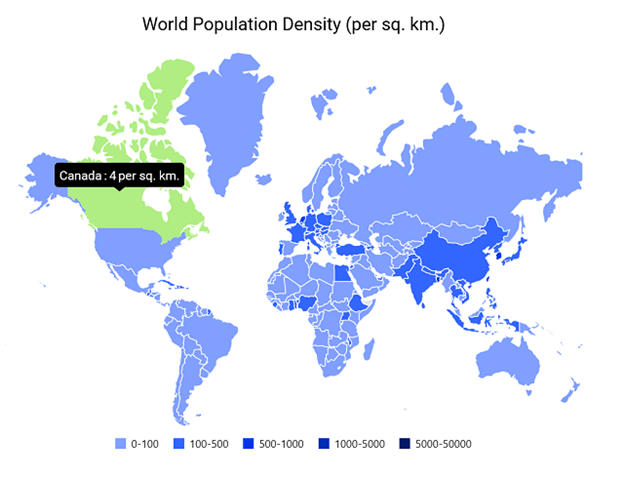
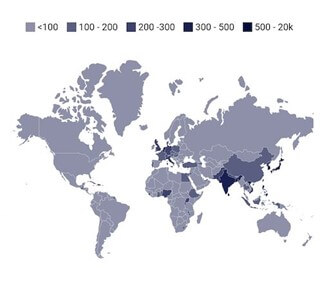
Range color mapping
Apply colors to regions if their data falls within a specific range. For example, you can apply colors to countries based on their population density.
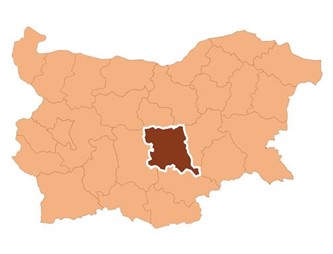
Selection
You can highlight a shape to focus attention on a specific area. Use this functionality to navigate pages and show detailed information about a selected area.
Add the .NET MAUI Maps to your application
Let’s see how to create a simple .NET MAUI app with the Maps control to demonstrate its primary usage.
Step 1: Create a .NET MAUI app.
First, create a new .NET MAUI app in Visual Studio.
Step 2: Install the NuGet packages.
Syncfusion .NET MAUI controls are available in NuGet Gallery. To add the SfMaps control to your project, open the NuGet package manager in Visual Studio. Search for Syncfusion.Maui.Maps and then install it.
Step 3: Handler registration.
The Syncfusion.Maui.Core NuGet package is a dependent package for all our Syncfusion .NET MAUI controls. In the MauiProgram.cs file, register the handler for Syncfusion core using the ConfigureSyncfusionCore() method.
Refer to the following code.
public static MauiApp CreateMauiApp()
{
  var builder = MauiApp.CreateBuilder();
  builder
    .UseMauiApp<App>()
    .ConfigureSyncfusionCore()
    .ConfigureFonts(fonts =>
    {
      fonts.AddFont("OpenSans-Regular.ttf", "OpenSansRegular");
      fonts.AddFont("OpenSans-Semibold.ttf", "OpenSansSemibold");
    });

  return builder.Build();
}
Step 4: Import the namespace.
Then, import the control namespace Syncfusion.Maui.Maps in your XAML or C# code.
xmlns:map="clr-namespace:Syncfusion.Maui.Maps;assembly=Syncfusion.Maui.Maps"
Step 5: Initialize the Maps control.
Now, initialize the SfMaps control.
<maps:SfMaps>
</maps:SfMaps>
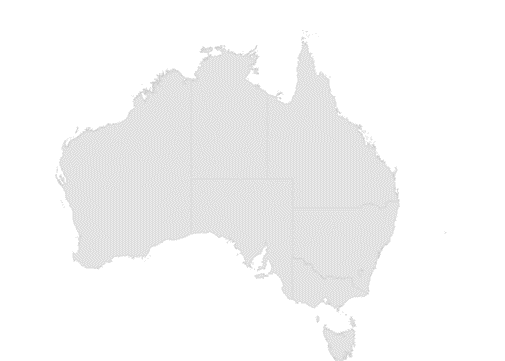
Step 6: Add GeoJSON or shapefile data to the shape layer.
The MapShapeLayer of SfMaps handles the actual geographical rendering. The shapes source, such as GeoJson or shapefile data, is set to the ShapesSource property of the MapShapeLayer.
The ShapesSource property is used to load the shapes of the map from different sources:
- FromFile: Returns a new MapSource object that reads the shape source from a local file.
- FromUri: Returns a new MapSource object that downloads and reads the shape source data from a specified URI.
- FromResource: Returns a new MapSource object that reads the shape source in an assembly.
- FromStream: Returns a new MapSource object that reads the shape source from a stream.
XAML
<map:SfMaps.Layer>
 <map:MapShapeLayer x:Name="layer">
  </map:MapShapeLayer>
 </map:SfMaps.Layer>
</map:SfMaps>
C#
public MainPage()
{
  InitializeComponent();
  this.layer.ShapesSource = MapSource.FromResource("GettingStarted_MAUI_Maps.australia.json");
}
Step 7: Map the data source for the shape layer.
The DataSource property accepts the collection of values as input. The PrimaryValuePath property refers to the data ID in the DataSource.
The ShapeDataField property of the MapShapeLayer is used to refer to the unique field name in the shape source (.json or .shp files) to identify each shape. When the values of the PrimaryValuePath property in the DataSource and the values of ShapeDataField in the shape data are matched, the associated object from the data source will be bound to the corresponding shape.
XAML
<map:SfMaps.Layer>
 <map:MapShapeLayer x:Name="layer" ShapeDataField="STATE_NAME" DataSource="{Binding Data}" PrimaryValuePath="State">
  </map:MapShapeLayer>
 </map:SfMaps.Layer>
</map:SfMaps>
C#
public class ViewModel
{
public ObservableCollection<Model> Data { get; set; }
public ViewModel()
{
Data = new ObservableCollection<Model>();
Data.Add(new Model("New South Wales", "New\nSouth Wales", 1));
Data.Add(new Model("Queensland", "Queensland",2));
Data.Add(new Model("Northern Territory", "Northern\nTerritory",3));
Data.Add(new Model("Victoria", "Victoria",4));
Data.Add(new Model("Tasmania", "Tasmania",5));
Data.Add(new Model("Western Australia", "Western Australia",6));
Data.Add(new Model("South Australia", "South Australia",7));
}
public class Model
{
public string State { get; set; }
public string StateCode { get; set; }
public int ID { get; set; }
public Model(string state, string stateCode, int id)
{
State = state;
StateCode = stateCode;
ID = id;
}
}
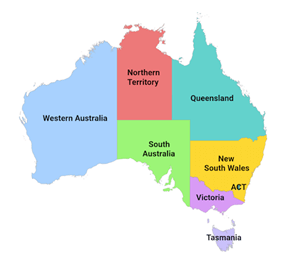
}Step 8: Add basic map elements.
Finally, add the essential map elements:
- Data labels: You can show data labels using the ShowDataLabels property and customize them using the DataLabelSettings property.
- Legend: You can enable a legend using the Legend property. The text of the legend will be displayed based on the ColorMapping.Text property. You can also customize the legend text using the TextStyle property.
- Tooltip: You can enable tooltips for the shapes using the ShowShapeTooltip property. One will be displayed when you interact with the shapes, i.e. while tapping using touch devices and hovering using the mouse.
- Color mapping: You can apply color for shapes using the EqualColorMapping or RangeColorMapping properties by mapping the ShapeColorValuePath property.
Refer to the following code.
<map:SfMaps>
 <map:SfMaps.Layer>
  <map:MapShapeLayer x:Name="layer" ShapeDataField="STATE_NAME" DataSource="{Binding Data}" PrimaryValuePath="State"
                       ShowDataLabels="True" ShowShapeTooltip="True" ShapeColorValuePath="ID">
    <!--Set Data Label-->
    <map:MapShapeLayer.DataLabelSettings>
     <map:MapDataLabelSettings DataLabelPath="StateCode" ></map:MapDataLabelSettings>
    </map:MapShapeLayer.DataLabelSettings>

    <!--Set Color mapping-->
    <map:MapShapeLayer.ColorMappings>
     <map:EqualColorMapping Color ="#d0b800" Value = "1" Text="NSW" />
     <map:EqualColorMapping Color = "#00d5cf" Value = "2"  Text="Queensland" />
     <map:EqualColorMapping Color ="#cf4eee" Value = "3" Text="Victoria" />
     <map:EqualColorMapping Color ="#4f93d8"  Value = "4" Text="Tasmania" />
     <map:EqualColorMapping Color = "#8b6adf" Value = "5" Text="WA"  />
     <map:EqualColorMapping Color ="#7bff67"  Value = "6" Text="SA" />
     <map:EqualColorMapping Color ="#ff4e42"  Value = "7" Text="NT" />
    </map:MapShapeLayer.ColorMappings>

    <!--Set Legend-->
    <map:MapShapeLayer.Legend>
     <map:MapLegend SourceType="Shape" Placement="Bottom" />
    </map:MapShapeLayer.Legend>
  </map:MapShapeLayer>
 </map:SfMaps.Layer>
</map:SfMaps>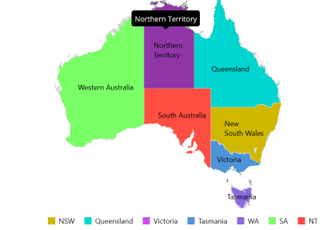
What’s next?
We plan to include more exciting features for the Maps control in our upcoming releases. Some of them are:
- Support for imagery layers such as Bing Maps, OpenStreetMap, etc.
- Zooming and panning.
- Legend interaction.
GitHub reference
For more information, refer to our .NET MAUI Maps Getting Started demo project.
Conclusion
Thanks for reading! In this blog, we walked you through our new Syncfusion .NET MAUI Maps control and its features rolled out in the 2022 Volume 2 release.
This control was developed with restructured APIs and the .NET MAUI graphics library with consideration for various use cases and performance aspects. For more details, check out the .NET MAUI Maps NuGet package and user guide.
Please let us know in the comments section below if you need a specific feature in our .NET MAUI Maps control. Also, you can contact us through our support forums, support portal, or feedback portal. We are always happy to assist you!


 No spam, just valuable updates.