
Are you looking for a tool to visualize data and show progress through a series of steps or stages?
Then our new .NET MAUI Funnel Charts is the ultimate choice!
The .NET MAUI Funnel Charts (SfFunnelChart) is an efficient tool for visualizing data flow from one stage to the next and identifying areas where progress might be slower or faster than expected. You can easily create and customize it to satisfy your specific needs.
This component was part of the Syncfusion Essential Studio® 2022 Volume 4 release.
In this blog, we will see the features of the .NET MAUI Funnel Charts and the steps to get started with it!
Features of .NET MAUI Funnel Charts
Data Labels
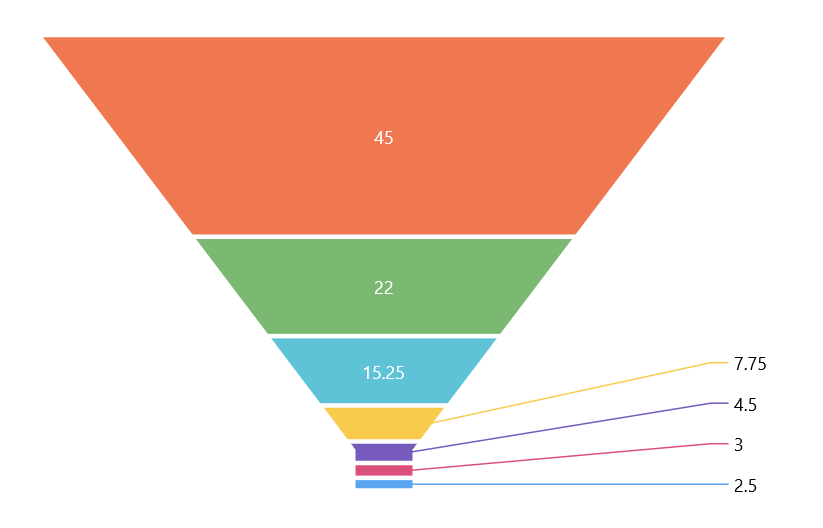
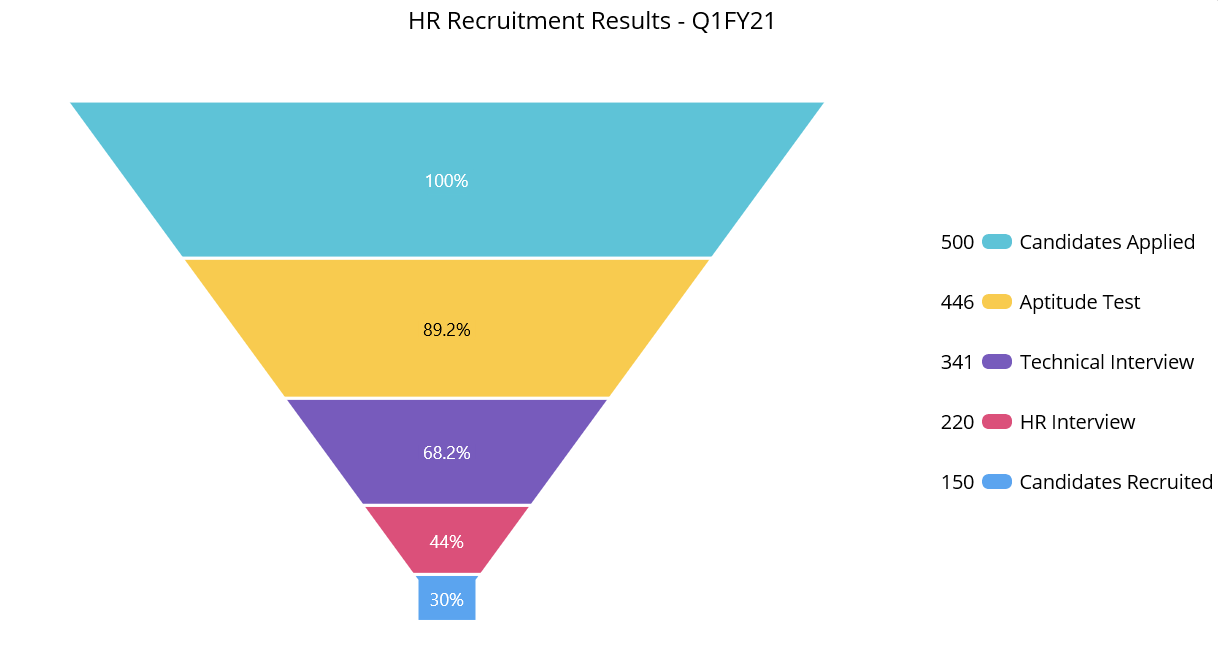
One of the Funnel Charts’ key features is its ability to display data labels with custom placement options. You can place the labels inside or outside of the funnel segments. This makes it easy to focus on the most important information and quickly identify the trends and patterns in the data.
The data labels smartly align themselves in space-constrained scenarios based on space availability. Thus, they improve the user experience and readability.
Tooltip
We can display information about each funnel segment while hovering over it using the tooltip feature. By default, the tooltip displays the value of each stage in the funnel.
With the help of the TooltipTemplate support, this can be customized to show other information using any .NET MAUI View control.
Legend
The Funnel Charts supports rendering a legend next to the funnel to display information about each segment or stage. By default, the legend will appear with the names of the funnel stages. You can customize it with any .NET MAUI view control using the ItemTemplate support.
Note: Refer to the .NET MAUI Funnel Charts documentation to see its other available features.
Getting started with .NET MAUI Funnel Charts
Let’s see how to get started with the .NET MAUI Funnel Charts and populate it with data in your application.
Step 1: First, create a .NET MAUI application.
Step 2: Syncfusion .NET MAUI components are available in the NuGet Gallery. To add the SfFunnelChart to your project, open the NuGet package manager in Visual Studio. Search for Syncfusion.Maui.Charts, and then install it.
Step 3: Now, register the handler for the Syncfusion core in the MauiProgram.cs file. Refer to the following code.
public static class MauiProgram
{
  public static MauiApp CreateMauiApp()
  {
      var builder = MauiApp.CreateBuilder();
      builder
	.UseMauiApp<App>()
	.ConfigureSyncfusionCore()
	.ConfigureFonts(fonts =>
         {
            fonts.AddFont("OpenSans-Regular.ttf", "OpenSansRegular");
            fonts.AddFont("OpenSans-Semibold.ttf", "OpenSansSemibold");
         });
      builder.ConfigureSampleBrowserBase();
      return builder.Build();
 }
}
Step 4: Import the Syncfusion.Maui.Charts namespace in your XAML page.
xmlns:chart="clr-namespace:Syncfusion.Maui.Charts;assembly=Syncfusion.Maui.Charts">
Step 5: Then, initialize an empty funnel chart like in the following code.
<chart:SfFunnelChart/>
Step 6: Create a business model to populate items in the Funnel Charts. This includes creating the example Model class and ChartViewModel with the list of data objects.
public class Model
{
public string ProgressName { get; set; }
public double Value { get; set; }
}
public class ChartViewModel
{
public ObservableCollection Data { get; set; }
public ChartViewModel()
{
Data = new ObservableCollection()
{
new Model(){ProgressName = "Process A", Value = 50},
new Model(){ProgressName = "Process B", Value = 20},
new Model(){ProgressName = "Process C", Value = 15},
new Model(){ProgressName = "Process D", Value = 5},
};
}
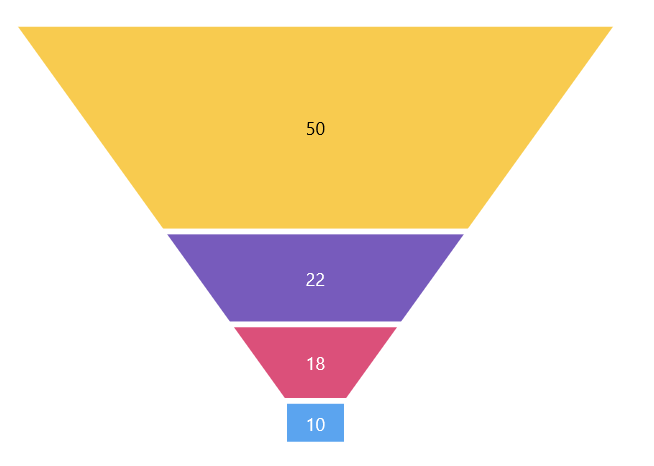
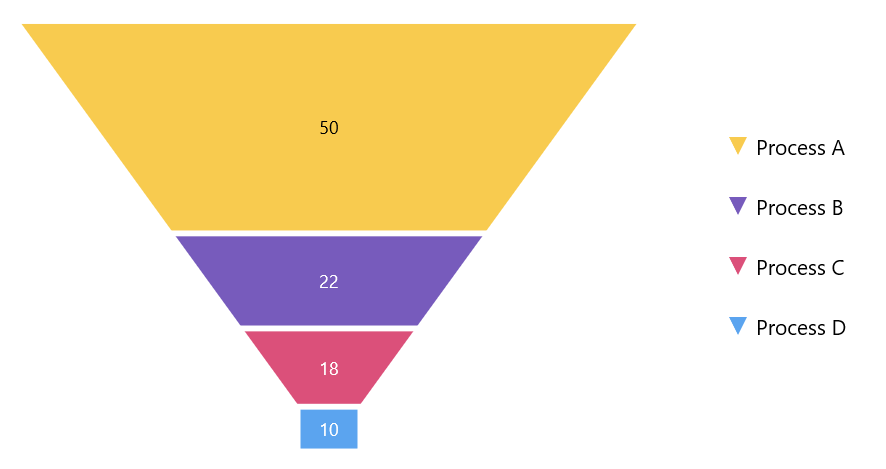
}Step 7: Finally, set the BindingContext to the ChartViewModel. Bind the data to the Funnel Charts’ ItemsSource property. Then, bind the ProgressName and Value properties with the XBindingPath, and YBindingPath properties, respectively.
<chart:SfFunnelChart ItemsSource="{Binding Data}"
                       XBindingPath="ProgressName"
                       YBindingPath="Value">
    <chart:SfFunnelChart.BindingContext>
        <local:ChartViewModel/>
    </chart:SfFunnelChart.BindingContext>
</chart:SfFunnelChart>
After executing these code examples, our funnel chart will look like the following image.

Conclusion
Thanks for reading! In this blog, we have seen the features of the new .NET MAUI Funnel Charts rolled out in the 2022 Volume 4 release. Information on other release enhancements is available on our Release Notes and What’s New pages. Try them out to visualize your data elegantly with better readability!
For questions, you can reach us through our support forum, support portal, or feedback portal. We are always happy to assist you!


 No spam, just valuable updates.