Syncfusion Showcases at Microsoft Build 2024 Graham High May 15, 2024 UPDATEDPopular Now Unveiling Exciting Features in Essential JS 2 Gantt Chart: 2023 Volume 4 Alan Sangeeth January 22, 2024 Chart of the Week: Creating a .NET MAUI Multiple Fast Line Chart to Analyze the Impact of Exported Goods on GDP Vimala Thirumalai Kumar May 14, 2024 UPDATED Introducing the New Blazor Data Form Component Saravanan G January 18, 2024 3 Simple Steps to Split an Excel File into Multiple Excel Files in C# Mohan Chandran March 1, 2024 UPDATED Chart of the Week: Creating a .NET MAUI Stacked Column Chart for Global Smartphone Shipments Sowndharya Selladurai May 14, 2024 UPDATED Blazor Synchronized Charts: The Perfect Tool for Trade Analysis Krishnan Periyasamy January 11, 2024 Unveiling the New Angular 3D Chart: A Step Forward in Data Visualization Gowrimathi S January 10, 2024 A Full-Stack Web App Using Angular and GraphQL: Data Fetching and Manipulation (Part 2) Ankit Sharma January 26, 2024 UPDATED Charting Magic: A Performance Boost with Syncfusion Flutter Charts Sheik Syed January 10, 2024 UPDATED What’s New in WPF Diagram: 2023 Volume 4 Prakash Perumal January 9, 2024 Succinctly Readers Awards 2024 Are on the Way! Rajeshwari P January 24, 2024 UPDATED Chart of the Week: Creating a .NET MAUI Scatter Chart to Visualize CO2 Emissions vs. Fossil Fuel Consumption Nanthini Mahalingam May 14, 2024 UPDATED 1 … 6 7 8 9 10 11 12 13 14 15 16 … 182 Be the first to get updates Subscribe Subscribe RSS feed
Unveiling Exciting Features in Essential JS 2 Gantt Chart: 2023 Volume 4 Alan Sangeeth January 22, 2024
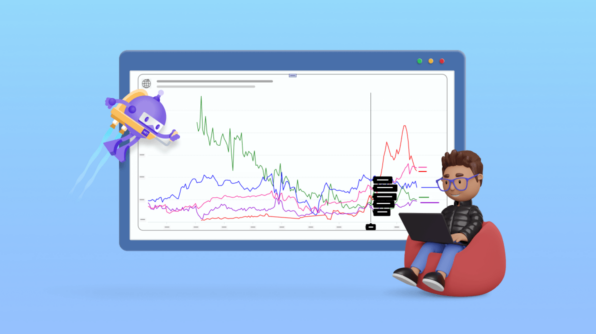
Chart of the Week: Creating a .NET MAUI Multiple Fast Line Chart to Analyze the Impact of Exported Goods on GDP Vimala Thirumalai Kumar May 14, 2024 UPDATED
3 Simple Steps to Split an Excel File into Multiple Excel Files in C# Mohan Chandran March 1, 2024 UPDATED
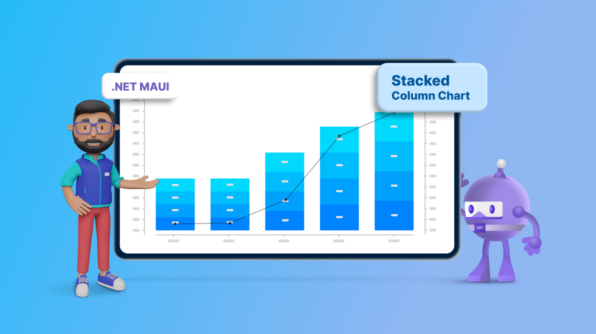
Chart of the Week: Creating a .NET MAUI Stacked Column Chart for Global Smartphone Shipments Sowndharya Selladurai May 14, 2024 UPDATED
Unveiling the New Angular 3D Chart: A Step Forward in Data Visualization Gowrimathi S January 10, 2024
A Full-Stack Web App Using Angular and GraphQL: Data Fetching and Manipulation (Part 2) Ankit Sharma January 26, 2024 UPDATED
Charting Magic: A Performance Boost with Syncfusion Flutter Charts Sheik Syed January 10, 2024 UPDATED
Chart of the Week: Creating a .NET MAUI Scatter Chart to Visualize CO2 Emissions vs. Fossil Fuel Consumption Nanthini Mahalingam May 14, 2024 UPDATED


