

Three-dimensional (3D) charts go beyond the limitations of traditional two-dimensional graphs, providing a dynamic canvas for illustrating complex datasets.
In Syncfusion’s Essential Studio® 2023 Volume 4 release, we are thrilled to introduce our latest addition—the Angular 3D Chart component. This cutting-edge tool is designed to improve data presentation by injecting depth and clarity into your visualizations. Let’s explore the features of this new Angular 3D Chart and the steps to get started with it!
Angular 3D Chart: An overview
The Angular 3D Chart component provides a graphical representation of data in three dimensions, showcasing relationships and trends among variables. Unlike traditional 2D charts, 3D charts add depth to the visualization, allowing for a better understanding of data patterns.
With tool, you can effortlessly create various 3D chart types: bar, stacked bar, 100% stacked bar, column, stacked column, 100% stacked column, pie, and doughnut.
Key features
The Angular 3D Chart component supports the following key features:
Let’s look at all of these more closely.
Chart types
The Angular 3D Chart component offers six versatile chart types, easily configurable, with built-in support for visually stunning effects:
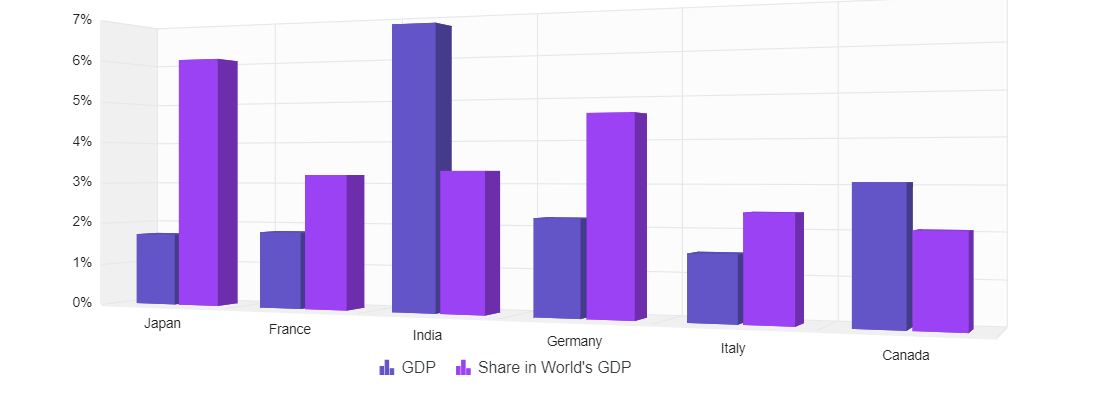
- Column: Represents data with vertical bars for easy value comparison.
- Bar: Utilizes horizontal bars to display data and facilitate value comparison.
- Stacked column: Plots data points on top of each other using vertical bars for comprehensive visualization.
- Stacked bar: Achieves the same effect as the stacked column but with horizontal bars.
- 100% stacked column: Illustrates the percentage distribution of multiple datasets within a total, with each column adding up to 100%.
- 100% stacked bar: Like the stacked column but using horizontal bars, showcasing the percentage distribution of datasets within a total.
Data binding
Effortlessly bind the 3D Chart component with an array of JSON objects or a data manager, with support for both local and remote data binding methods. In addition to the chart series, data labels and tooltips can also be bound to your data.
Data labels
Annotate points with labels to improve the readability of data. Enhance these labels with HTML elements such as images, DIVs, and spans, creating informative and visually appealing data representations.
Axis types
Plot number, date-time, logarithmic, and string data types in the chart axis. The axis features include:
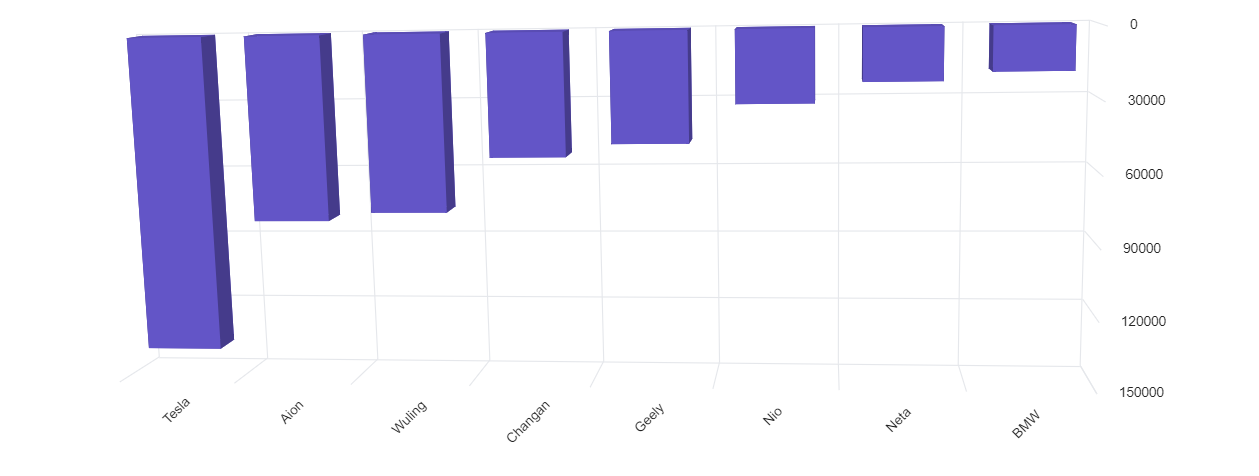
- Inversed axis: Flip the axis direction from its default orientation.
- Opposed position: Display the axis in the opposite position.
- Multiple axes: Include more than one axis on the same or opposite side.
- Smart labels: Add dynamic labels that automatically position themselves to enhance readability and prevent overlapping.
Legends
Provide additional information about the data series using a customizable legend. Labels and symbols aid viewers in identifying and differentiating between various series within the chart.
User interaction
You can also add interactive features to the 3D charts:
- Tooltip: A small, informative pop-up box offering additional context, details, or information when users hover over or click on data points.
- Highlight and selection: Easily highlight and select data points for improved comprehension. Adding patterns and colors to selected data enhances chart interactivity.
Rotation and tilt
In addition to the previous features, the Angular 3D Chart supports:
- Rotation: Dynamically rotate the 3D Chart from 0 to 360 degrees around a fixed point or axis in a three-dimensional space. Rotation can occur in a clockwise or counterclockwise direction.
- Tilt: Alter the inclination angle of the chart along one axis, providing a different perspective.
Getting started with the Angular 3D Chart component
We’ve explored the stunning features of the new Angular 3D Chart. Let’s see how to use it to visualize data!
Step 1: Create an Angular application
First, create an Angular application by using the following command.
ng new-my app
cd my-app
Step 2: Install the Syncfusion Angular Charts NuGet package
Add the Syncfusion Angular Charts NuGet package to the application.
npm install @syncfusion/ej2-angular-charts –save
Step 3: Register the 3D Chart module
Import the 3D Chart module into the Angular app in the app.module.ts file.
Refer to the following code example.
import { NgModule } from '@angular/core';
import { BrowserModule } from '@angular/platform-browser';
// import the ChartModule for the Chart component
import { Chart3DModule } from '@syncfusion/ej2-angular-charts';
import { AppComponent }  from './app.component';

@NgModule({
  //declaration of ChartModule into NgModule
  imports:      [ BrowserModule, Chart3DModule ],
  declarations: [ AppComponent ],
  bootstrap:    [ AppComponent ]
})
export class AppModule { }
Then, modify the template in the app.component.ts file to render the 3D Chart.
import { Component, ViewEncapsulation } from '@angular/core';

@Component({
  selector: 'app-container',
  // specifies the template string for the 3D Charts component
  template: `<ejs-chart3d id='chart-container'></ejs-chart3d>`,
  encapsulation: ViewEncapsulation.None
})

export class AppComponent  { }
Use the app-container in the index.html file instead of the default one.
<app-container></app-container>
Step 4: Populate the chart with data
Bind the JSON data to the Angular 3D Chart in the App.component.ts file.
import { Component, OnInit } from '@angular/core';
@Component({
selector: 'app-container',
template: `<ejs-chart3d style='display:block;' align='center' [primaryXAxis]='primaryXAxis' [primaryYAxis]='primaryYAxis'
rotation=7 tilt=10 depth=100 [enableRotation]='enableRotation'>
<e-chart3d-series-collection>
<e-chart3d-series [dataSource]='dataSource' type='Column' xName='x' yName='y'>
</e-chart3d-series>
</e-chart3d-series-collection>
</ejs-chart3d>`
})
export class AppComponent implements OnInit {
public dataSource?: Object[];
public primaryXAxis?: Object;
public primaryYAxis?: Object;
public enableRotation?: boolean;
ngOnInit(): void {
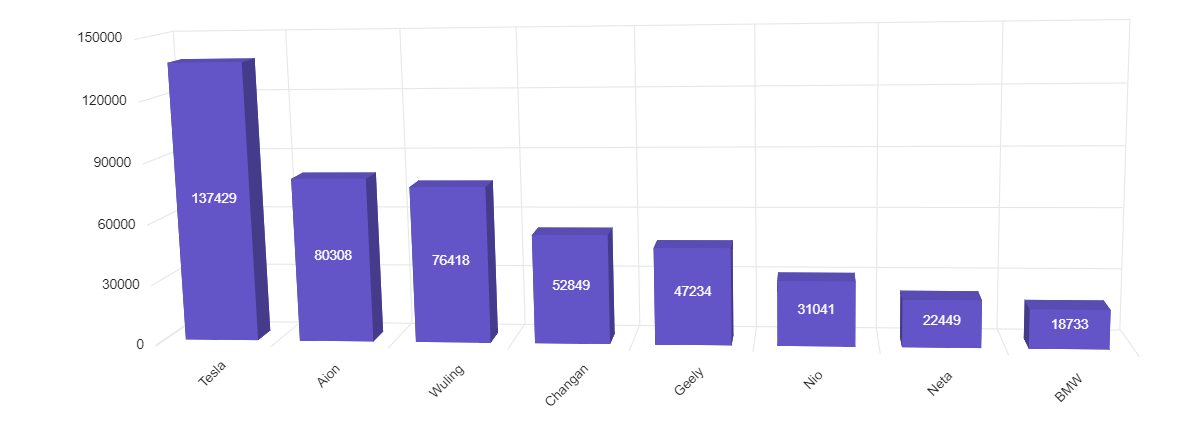
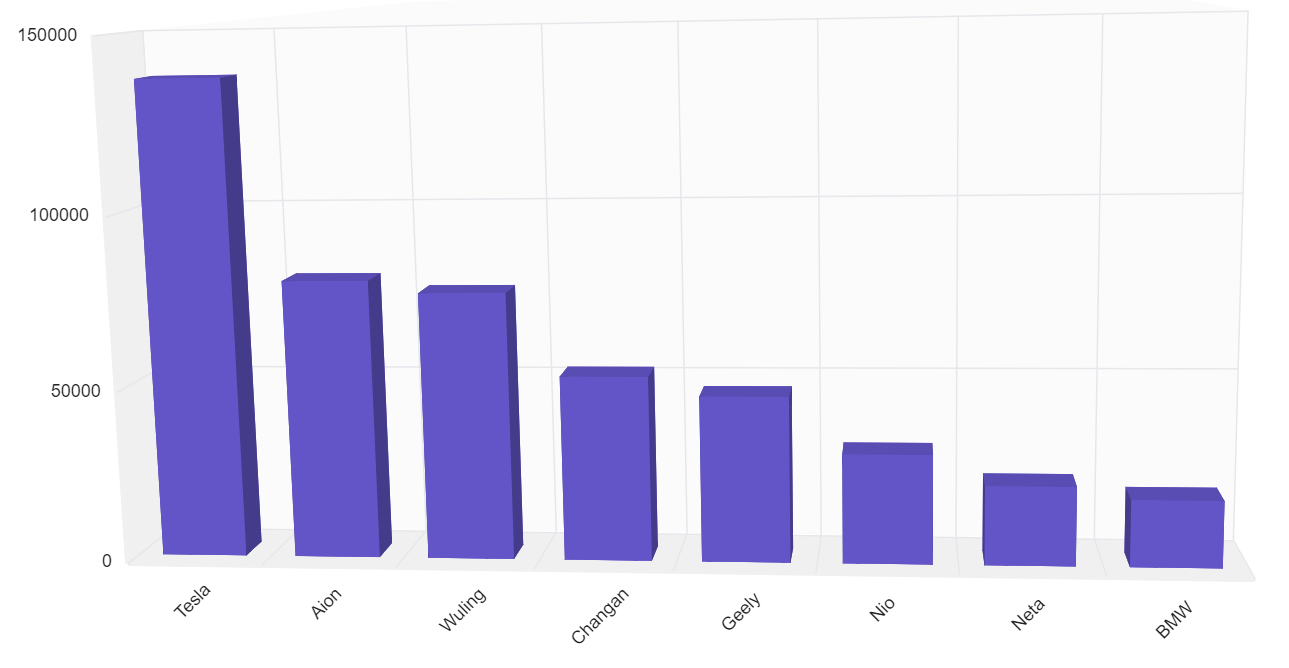
this.dataSource = [
{ x: 'Tesla', y: 137429 }, { x: 'Aion', y: 80308 },
{ x: 'Wuling', y: 76418 }, { x: 'Changan', y: 52849 },
{ x: 'Geely', y: 47234 }, { x: 'Nio', y: 31041 },
{ x: 'Neta', y: 22449 }, { x: 'BMW', y: 18733 }];
this.primaryXAxis = {
valueType: 'Category',
labelRotation: -45,
labelPlacement: 'BetweenTicks'
};
this.primaryYAxis = {
maximum: 150000,
interval: 50000
};
this.enableRotation = true;
}
}Step 5: Run the app
Finally, run the app in the browser using the following command.
npm start
After executing the previous code examples, we’ll get output like in the following image.
References
For more details, refer to the Angular 3D Chart documentation and demos.
Conclusion
Thank you for taking the time to explore our new Angular 3D Chart component, a remarkable addition to our 2023 Volume 4 release. This powerful tool is designed to improve your app development process, and we’re eager to hear your thoughts on it. Don’t hesitate to share your opinion in the comments section.
For a detailed overview of all the exciting updates in this release, we invite you to visit our Release Notes and What’s New pages. For our existing customers, the new version of Essential Studio® is available on the License and Downloads page. If you’re new to Syncfusion, we offer a 30-day free trial so you can experience the wide array of features we provide. It’s a great opportunity to explore how our tools can enhance your development process.
If you have any questions, you can reach us through our support forum, support portal, or feedback portal. Your satisfaction is our top priority, and we’re always happy to assist you in any way we can.
 No spam, just valuable updates.