When clicking a stacked bar chart, get data for the other bars in the same column
1 Reply
SIGN IN To post a reply.

|
<ejs-chart id="container" load="window.onChartLoad" title="Sales Comparison" PointClick="pointClick">
<e-chart-primaryxaxis valueType="Category">
<e-majorgridlines width="0"></e-majorgridlines>
</e-chart-primaryxaxis>
<e-series-collection>
<e-series dataSource="ViewBag.dataSource" xName="x" yName="y" name="Apple" width=2 type="@Syncfusion.EJ2.Charts.ChartSeriesType.StackingBar"></e-series>
<e-series dataSource="ViewBag.dataSource1" xName="x" yName="y" name="Orange" width=2 type="@Syncfusion.EJ2.Charts.ChartSeriesType.StackingBar"></e-series>
<e-series dataSource="ViewBag.dataSource2" xName="x" yName="y" name="Pears" width=2 type="@Syncfusion.EJ2.Charts.ChartSeriesType.StackingBar"></e-series>
</e-series-collection>
</ejs-chart>
<script>
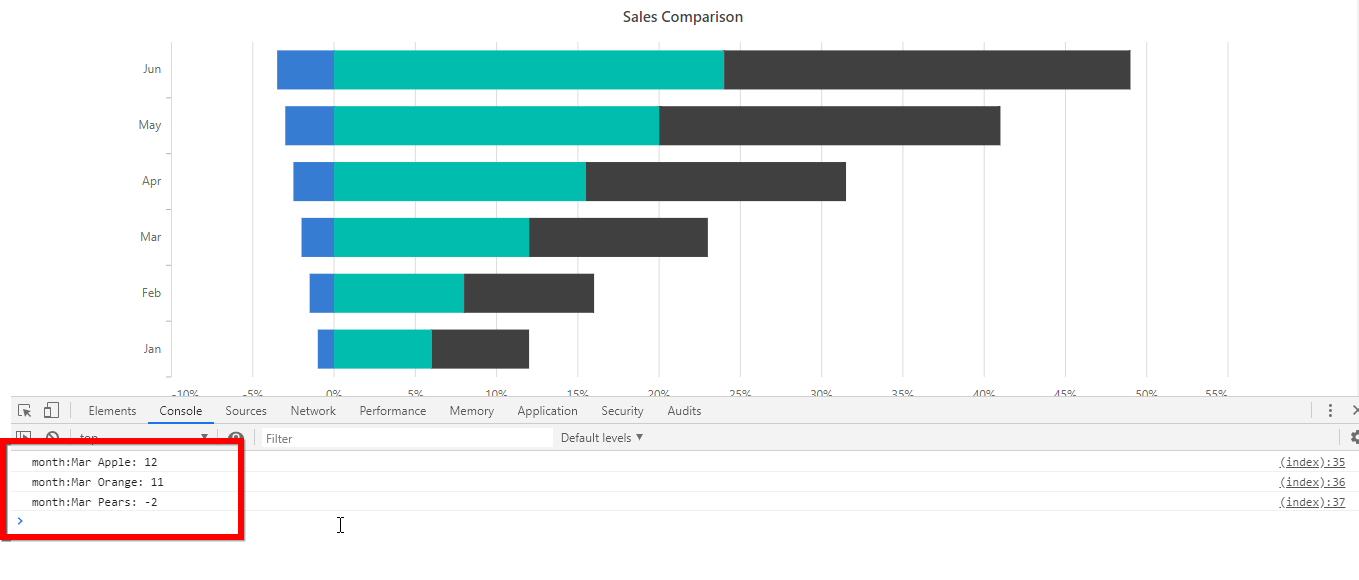
var pointClick = function (args) {
var chart = document.getElementById("container").ej2_instances[0];
console.log('month:' +chart.series[0].dataSource[args.pointIndex].x + " " + 'Apple: ' + chart.series[0].dataSource[args.pointIndex].y);
console.log('month:' +chart.series[1].dataSource[args.pointIndex].x + " " + 'Orange: ' + chart.series[1].dataSource[args.pointIndex].y);
console.log('month:' +chart.series[2].dataSource[args.pointIndex].x + " " + 'Pears: ' + chart.series[2].dataSource[args.pointIndex].y);
};
</script> |