Common
Production-ready Component
The following .NET MAUI controls have been developed to meet industry standards and are now marked as production-ready in this 2026 Volume 3 release:
- Rich Text Editor
New components
The following controls have been added to .NET MAUI.
- Data Pager
- Diagram
- Grid Splitter
- Interactive Viewer
- Tree Grid
Data Pager (preview)
We are excited to introduce the Data Pager, a flexible paging control that helps users navigate large datasets efficiently. It delivers an intuitive paging experience and improves application performance by displaying data in manageable pages.
Key features
Paging: Easily divide large datasets into smaller pages and provide intuitive navigation controls.
On-demand paging: Load data dynamically as users navigate between pages, reducing memory usage and improving application responsiveness.
Pager appearance customization: Customize button shapes, sizes, and fonts, and adjust the overall pager appearance to match the application’s design.
Display modes: Choose from different pager display modes to present page information and navigation controls in the most suitable format.
Programmatic page navigation: Navigate to specific pages programmatically.
Orientation: Display paging controls horizontally or vertically to accommodate different layouts.
Styling and theming: Apply custom styles and themes to create a consistent and visually appealing paging experience across the application.

Diagram (preview)
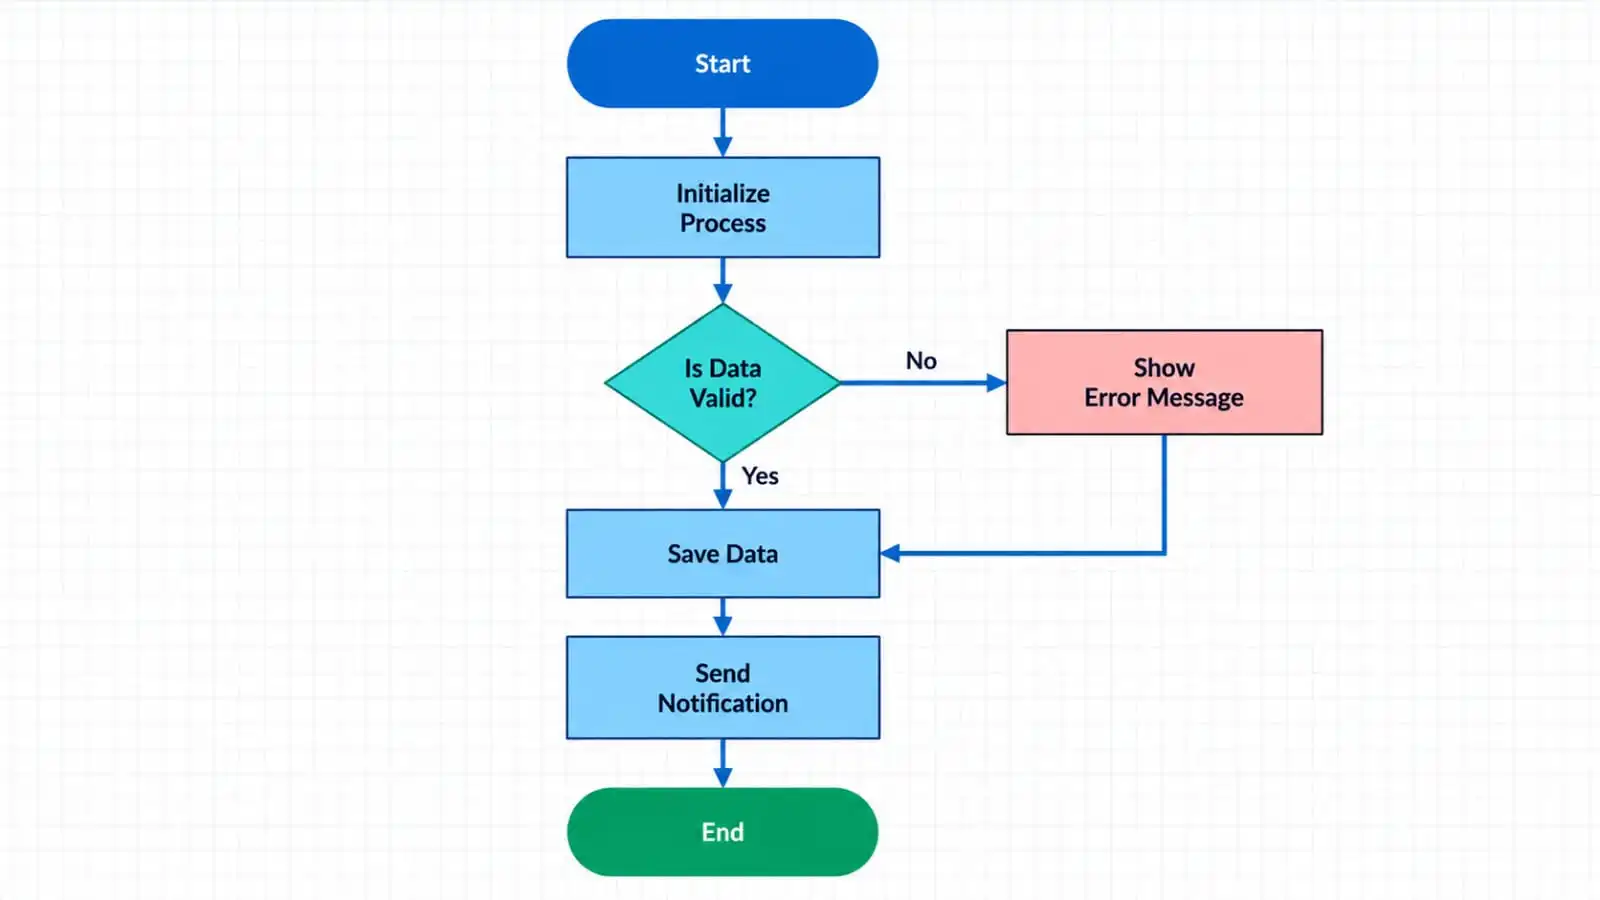
The .NET MAUI Diagram control enables users to create interactive diagrams like flowcharts with customizable nodes and connectors. It provides rich editing features, user interactions, zooming, panning, and cross-platform support.
Key Features
-
Node: Create and customize diagram nodes using a wide range of predefined shapes, paths, and templates. Configure their dimensions, positioning, appearance, and interaction behavior to represent distinct entities within the diagram.
-
Connector: Establish relationships between nodes with straight or orthogonal connectors. Customize line segments, stroke styling, bridge crossings, and source/target decorators like arrows and circles.
-
Annotation: Add text labels and path annotations to nodes and connectors. Tailor text appearance, alignment, positioning, and wrapping to convey clear contextual information.
-
Port: Define explicit, customizable connection points on nodes to control precisely where connectors attach and route.
-
Symbol palette: Offer an interactive symbol palette housing reusable shapes, nodes, and connectors, enabling users to effortlessly drag and drop elements onto the diagram canvas.
-
Save and load: Serialize and persist diagram state as data to restore complete visual layouts across application sessions seamlessly.
-
Export and print: Export diagrams to common image formats for external sharing, or print them directly from the application.
Grid Splitter (preview)
The new Grid Splitter is a user interface component designed for runtime resizing of grid-based layouts. This control enables users to dynamically adjust row heights and column widths using touch or mouse interactions, providing a flexible and intuitive layout management experience while maintaining layout integrity and consistent behavior across supported platforms.
Key features
- Resizable panes allow users to resize adjacent content regions using drag interactions.
- Users can expand or collapse panes through built-in expand and collapse icons.
- Horizontal and vertical orientations support both side-by-side and top-to-bottom pane arrangements.
- Users can define the minimum and maximum pane sizes.
- Runtime pane management allows users to add, remove, collapse, and expand panes programmatically.
- Users can change separator size, color, resize icon, and icon templates.
- Seamless right-to-left layout behavior.
- Uniform behavior across Android, iOS, Windows, and macOS platforms.

Interactive Viewer (preview)
This new control enables flexible content viewing with intuitive zoom, pan, rotate, and reset interactions.
Key features
- Zoom and pan effortlessly to explore content in greater detail.
- Rotate content for flexible viewing in any orientation.
- Reset to return content to its original view.
- Display any .NET MAUI view and transform it into an interactive viewing experience.
- Adapt to light and dark themes with built-in support.
- Customize zoom interactions and user experiences with extensible events.
- Build interactive viewing experiences for Android, iOS, macOS, and Windows using a single code base.

TreeGrid (preview)
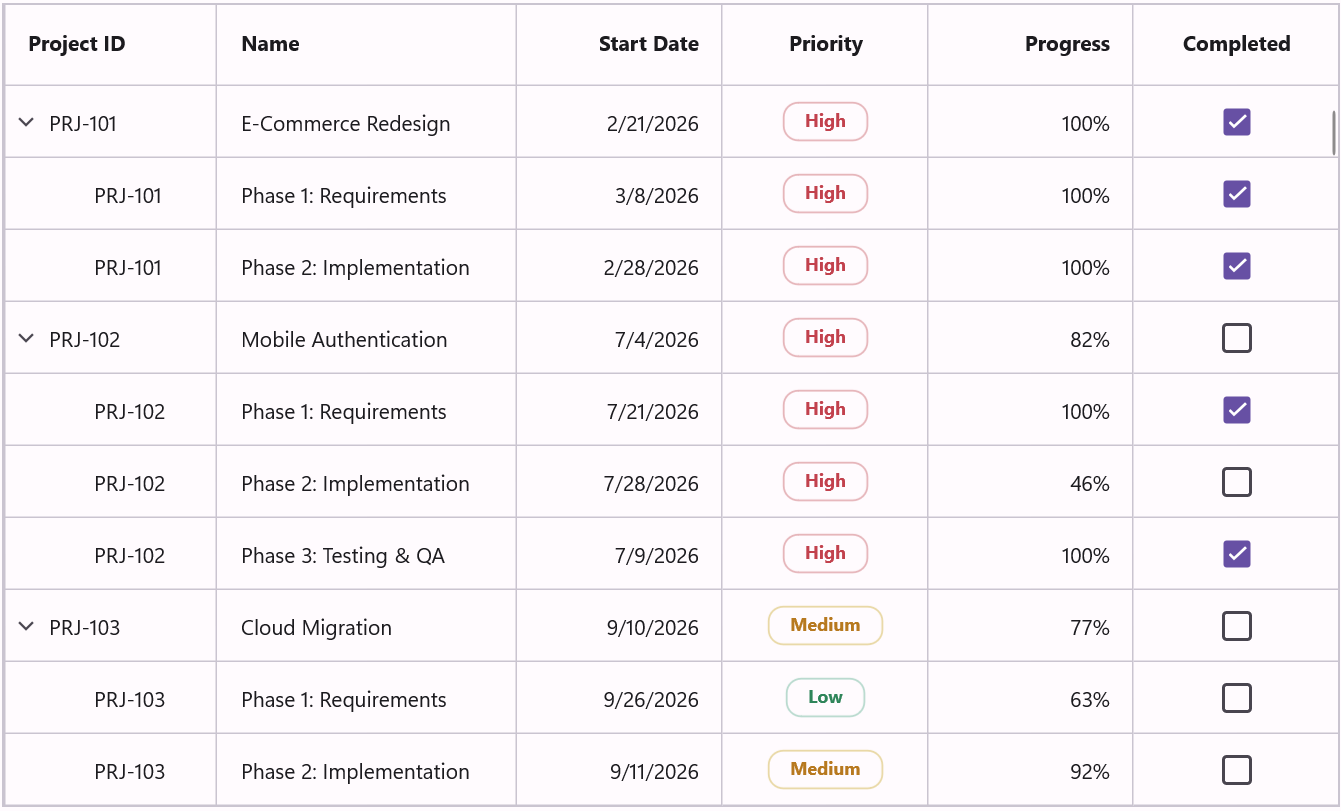
We are excited to introduce the TreeGrid, a powerful hierarchical data visualization control that displays self-referential and nested data in a tree structure. It combines the flexibility of a tree view with the rich functionality of a data grid, enabling users to organize, navigate, and interact with hierarchical datasets efficiently.
Key features
Data binding: Easily bind hierarchical data collections to the TreeGrid for seamless visualization and management of parent-child relationships.
Columns: Define and customize multiple columns to display structured information, providing a clear and organized view of hierarchical data.
Sorting: Sort hierarchical data by one or more columns to quickly identify and organize information while preserving the tree structure.
Programmatic filtering: Apply filters programmatically to display only the relevant records, enabling dynamic data exploration and customized views based on application requirements.
Freeze panes: Keep essential rows or columns visible while scrolling through large datasets, improving navigation and data readability.
Expand and collapse nodes: Allow users to expand and collapse parent nodes interactively, making it easy to navigate large data hierarchies while maintaining a clean user interface.
Expander customization: Customize the appearance and behavior of expanders to meet application requirements and enhance the overall user experience.
Styling and theming: Customize the TreeGrid’s appearance with extensive styling and theming options to create visually consistent and engaging applications.
Directionality: Use both left-to-right (LTR) and right-to-left (RTL) layouts to ensure an optimal viewing experience across languages and regional preferences.
AI AssistView
Markdown rendering and response streaming
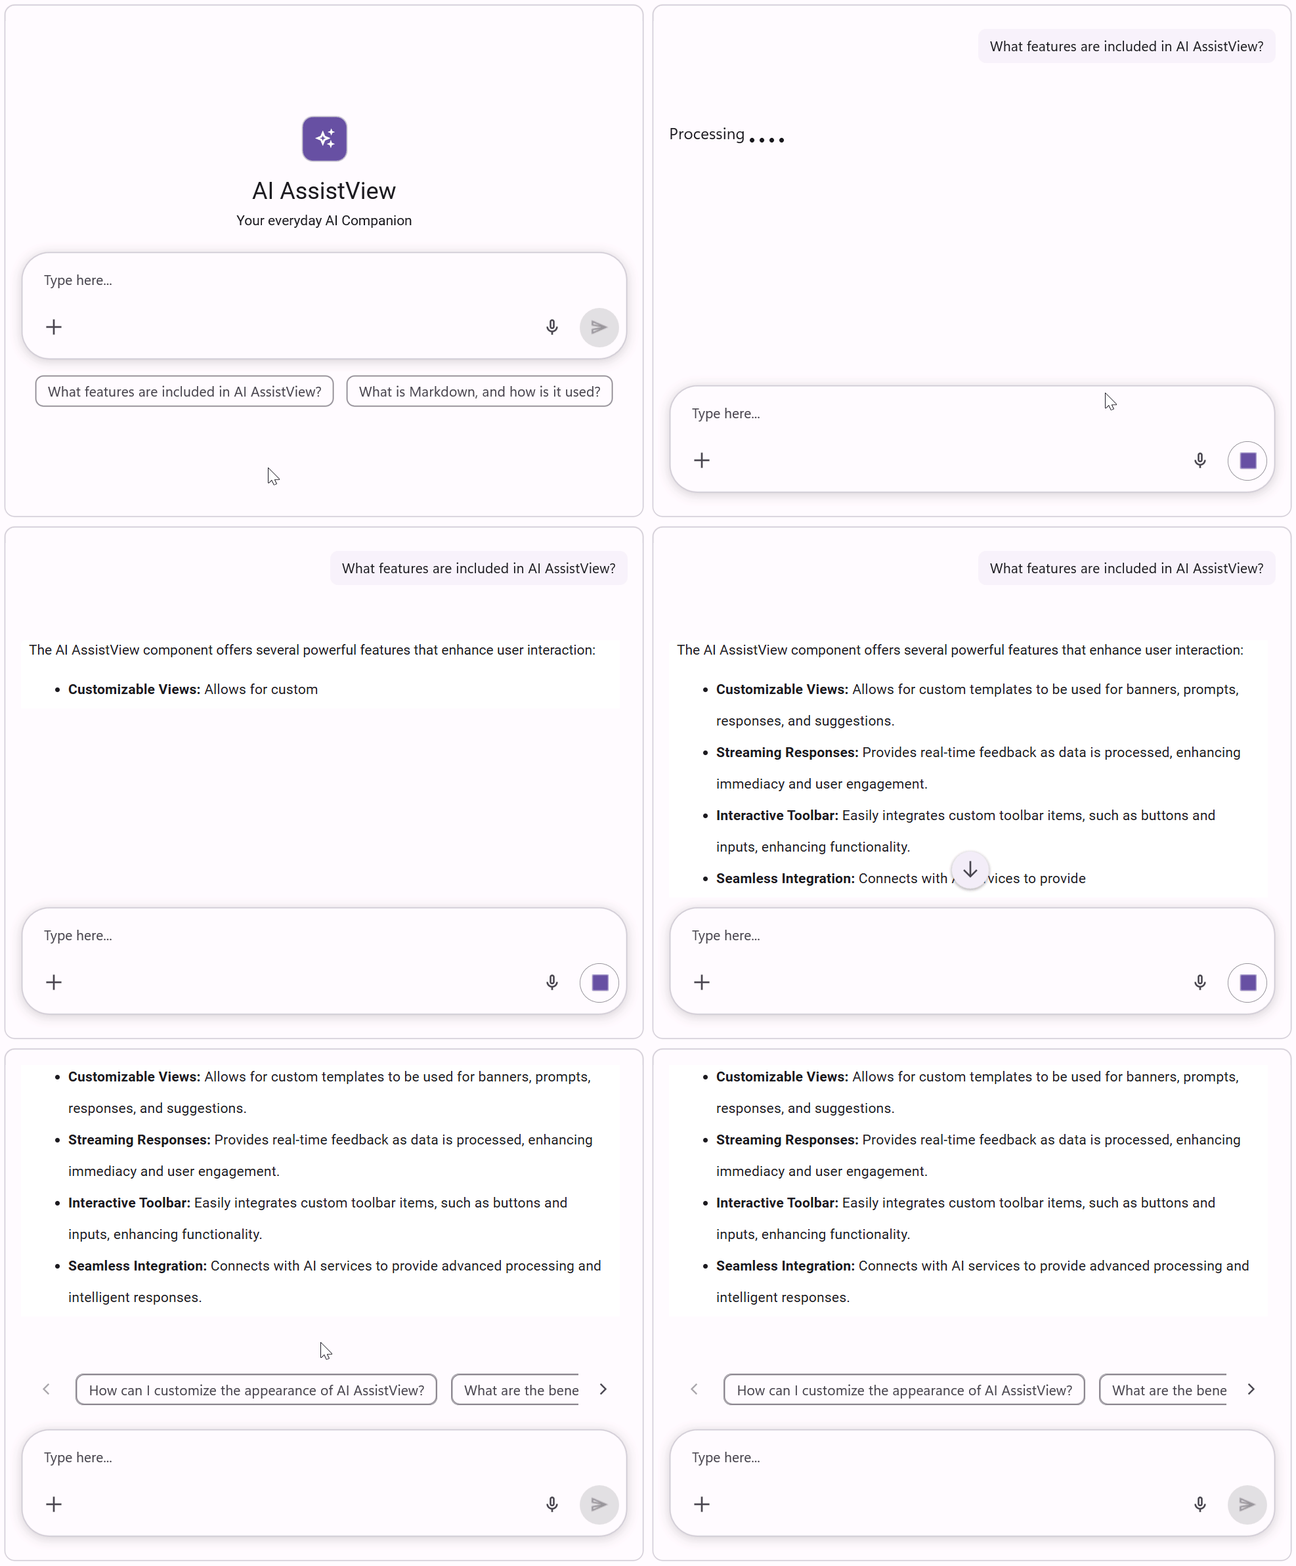
This feature lets users view rich, formatted AI responses with real‑time streaming, improving readability, engagement, and the overall conversational experience.
Prompt library
This feature allows users to quickly discover, browse, and reuse predefined prompts from a centralized library, improving productivity and ensuring consistent AI interactions.

Cartesian Charts
Gradients in line series
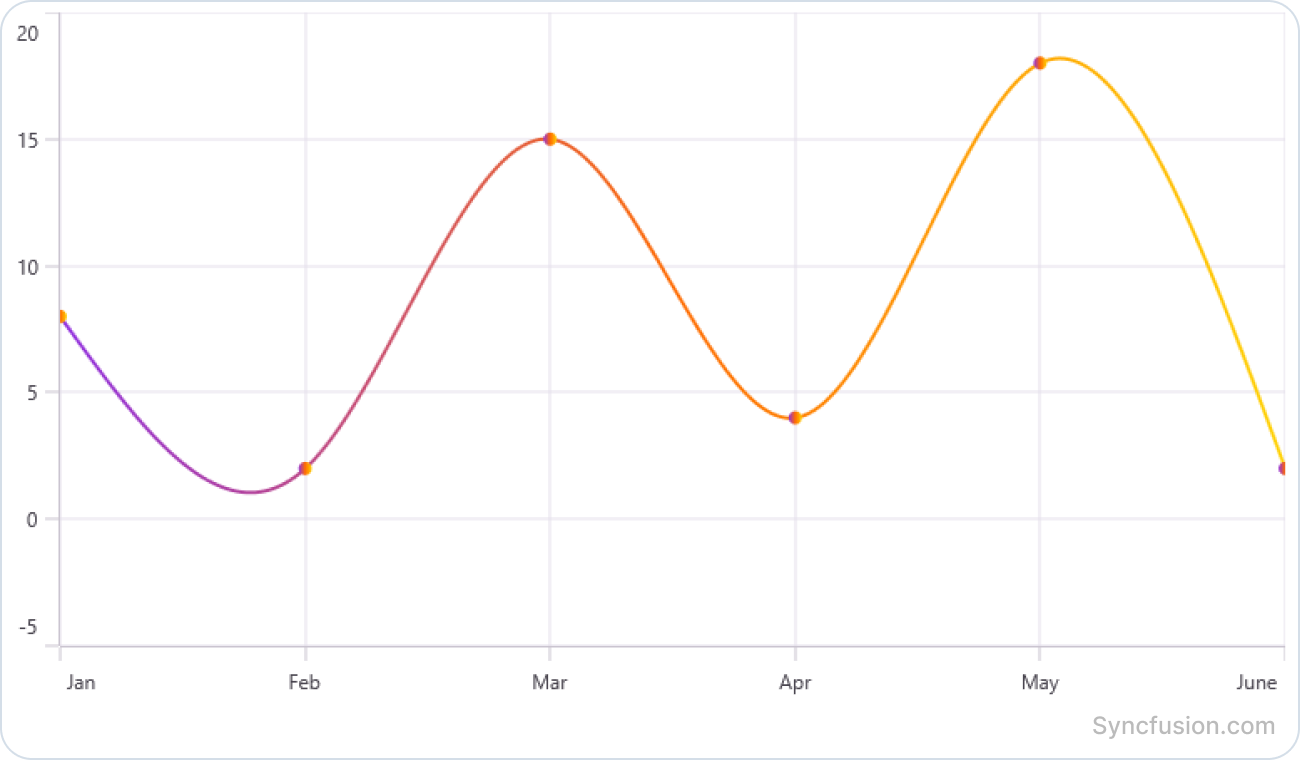
Apply smooth color transitions to line series using gradient brushes. This feature enhances visual appeal and enables more expressive data representation.
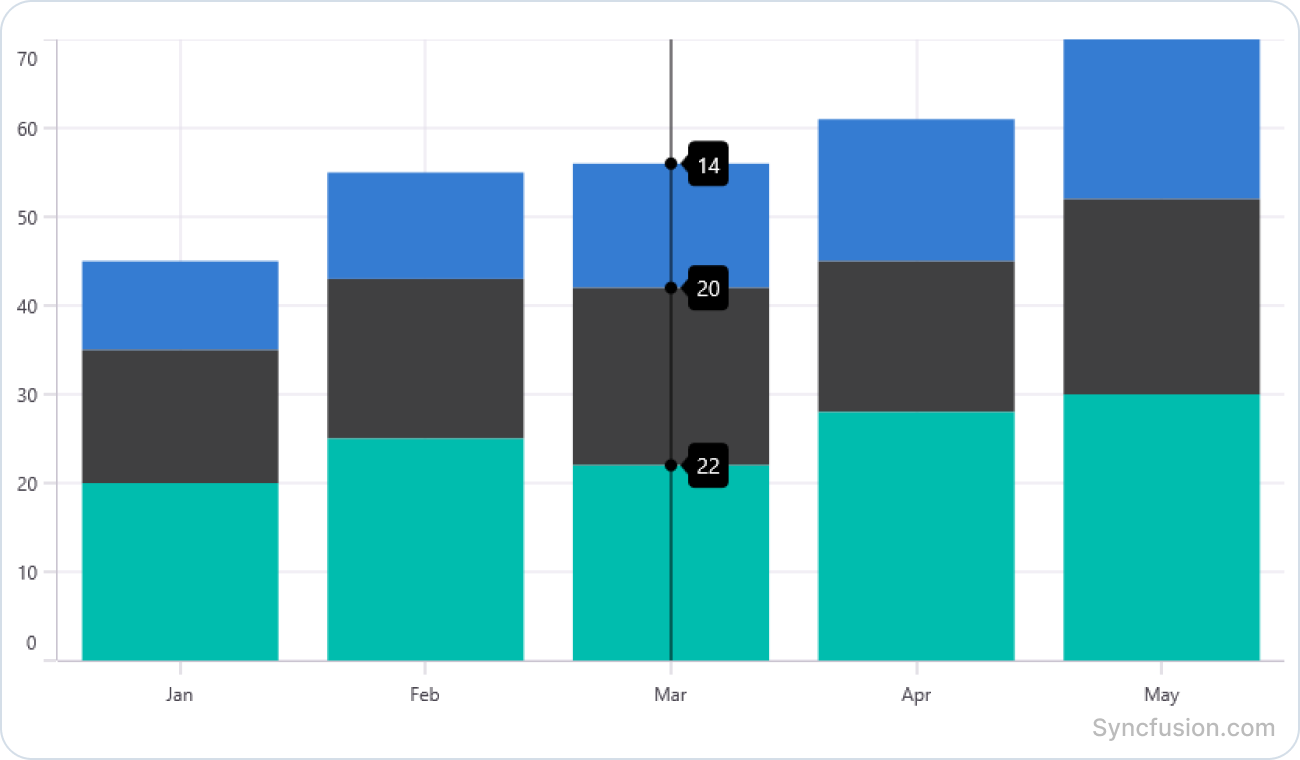
Trackball for stacked column series
View detailed values through an interactive trackball in stacked column series. Nearest-point, group-all-points, and float-all-points display modes provide flexible options for analyzing and comparing stacked data.
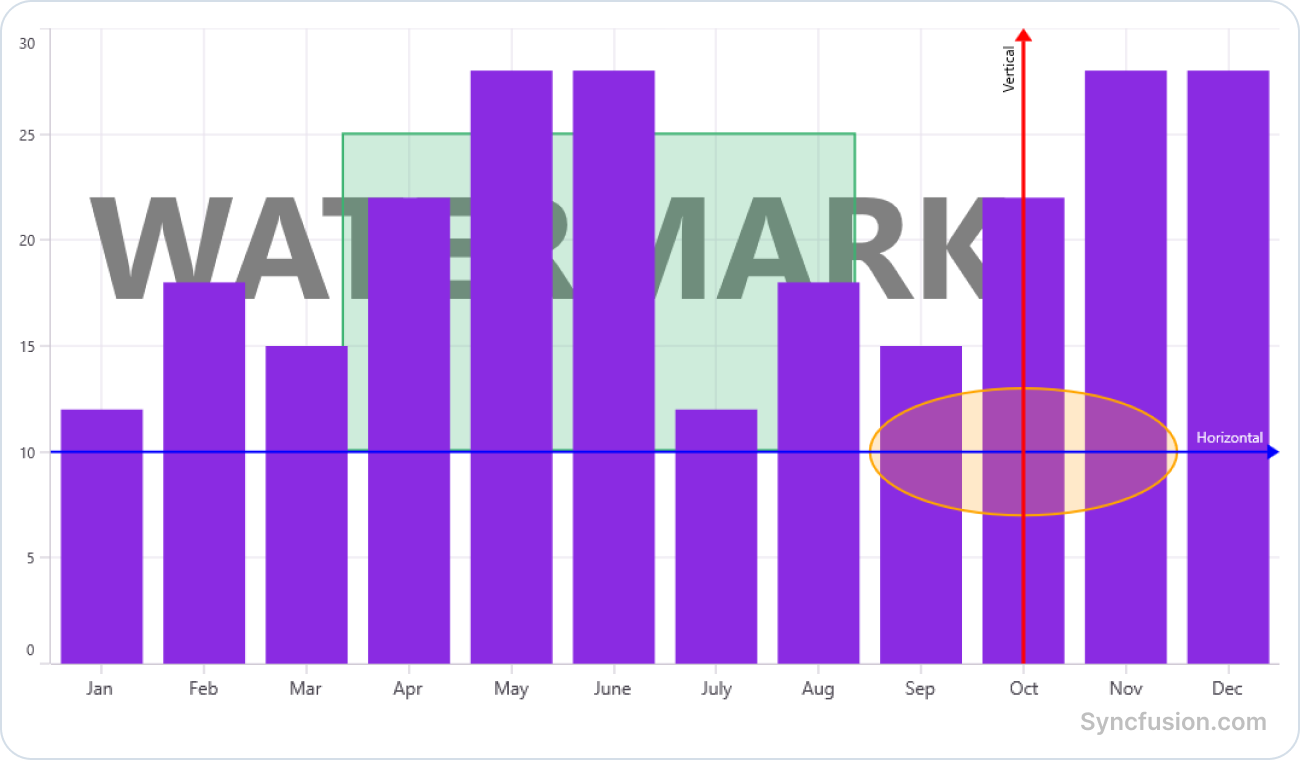
Annotation z-order
Control the display order of chart annotations to place them above or below chart series, enabling more flexible and visually organized chart presentations.
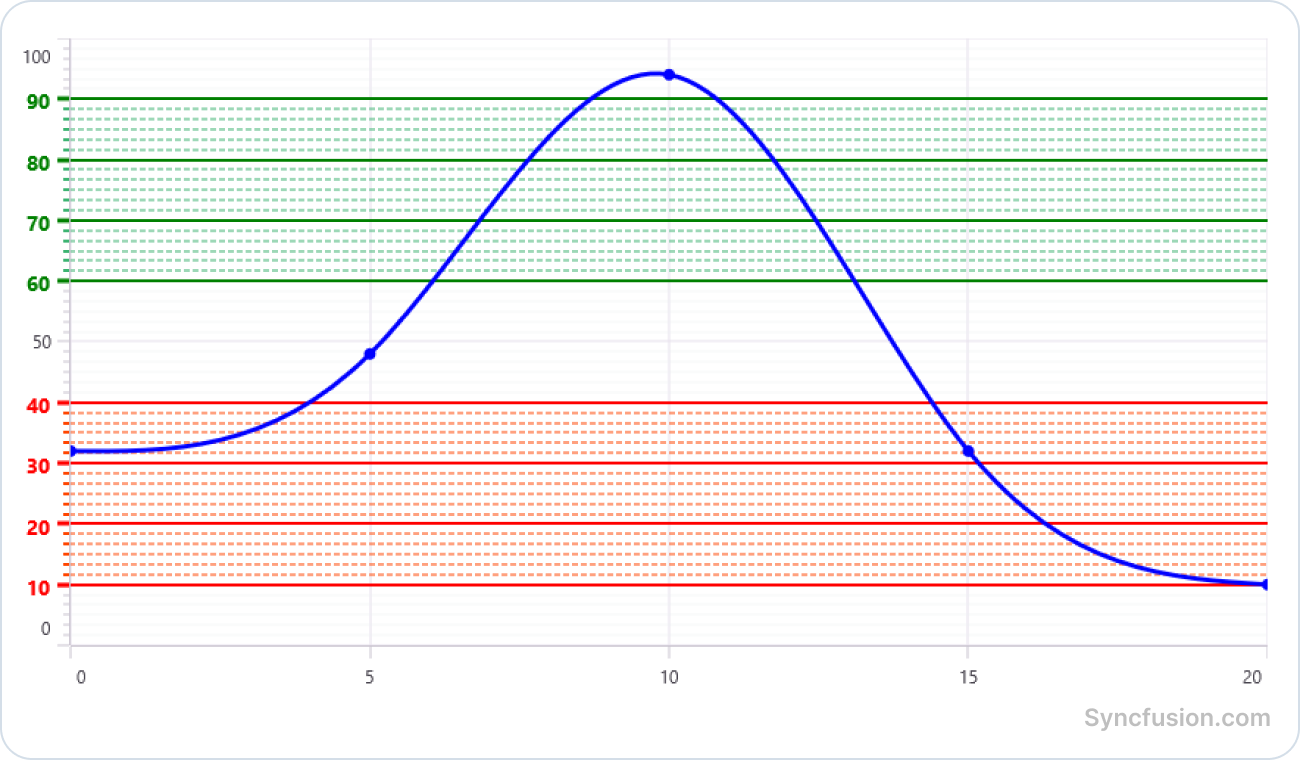
Axis range styling
Customize the appearance of axis labels, gridlines, and tick lines within specific axis ranges. This feature helps highlight important thresholds, target ranges, and critical data intervals for improved chart readability and analysis.
DataGrid
Multirow view
This feature allows a single data record to be displayed across multiple rows, improving the presentation of complex datasets. It provides a flexible layout for organizing related fields, enhancing readability and enabling efficient data visualization within the DataGrid.

Polar Charts
Accessibility
This enhancement improves chart usability for users of assistive technologies by providing better navigation and interaction with chart elements.
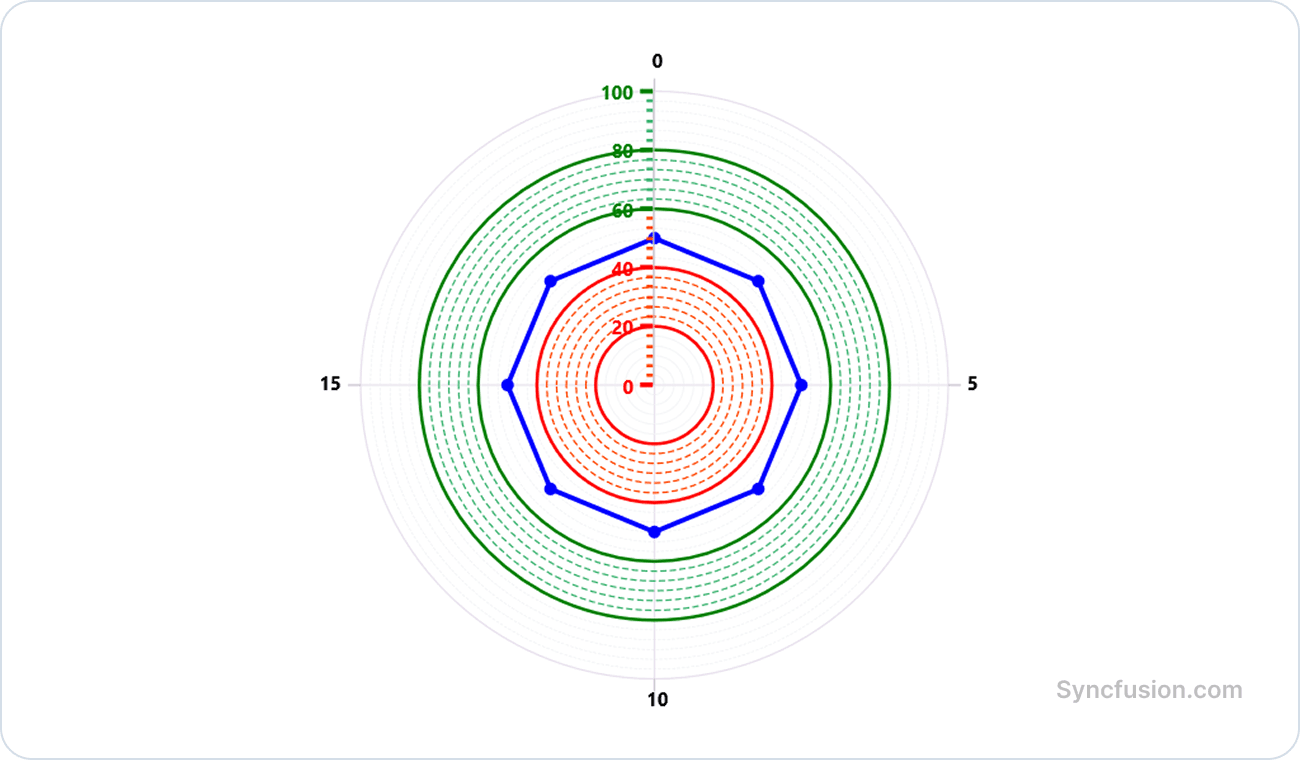
Axis range style
Customize the appearance of axis labels, gridlines, and tick lines within specific axis ranges. This feature helps highlight important thresholds, target ranges, and critical data intervals for improved chart readability and analysis.
RichTextEditor
Grouping
The Overlay Toolbar enhances the mobile editing experience by showing context-aware formatting options. When IsGrouped is enabled, related toolbar items are grouped into overlay menus, creating a cleaner, more intuitive interface that optimizes screen space on mobile platforms. This lets users quickly access formatting commands without interrupting their editing workflow.

Scheduler
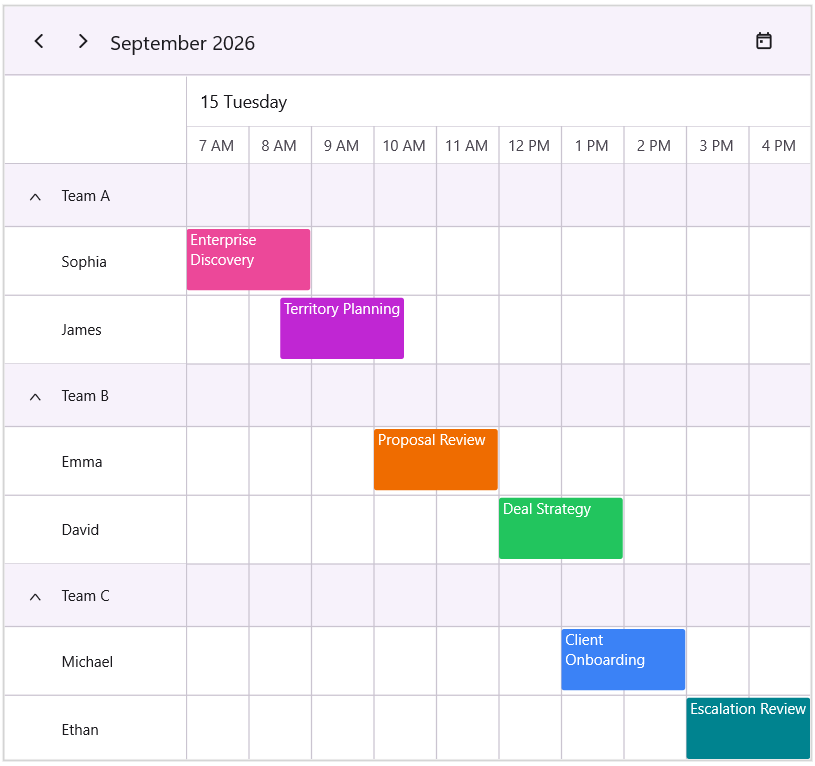
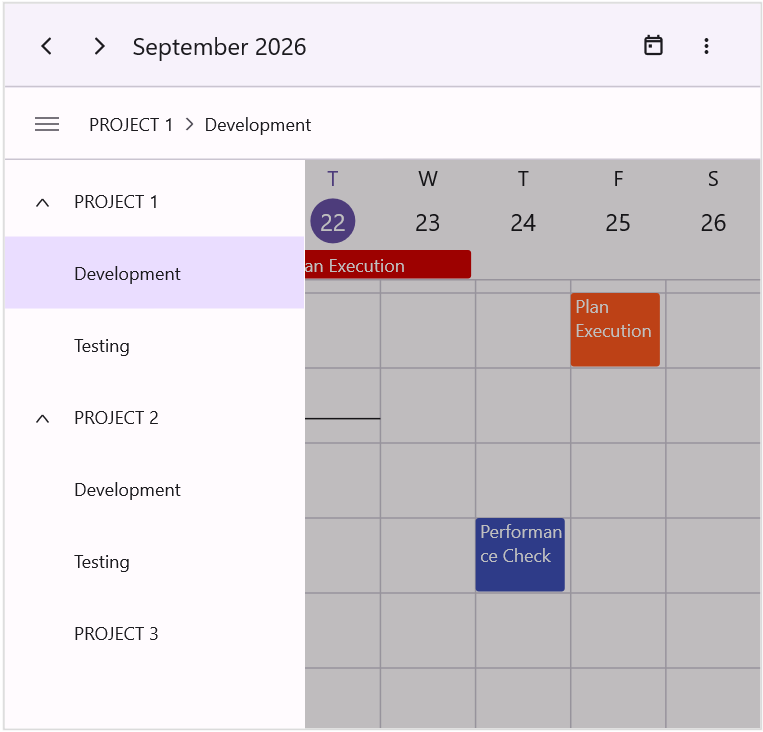
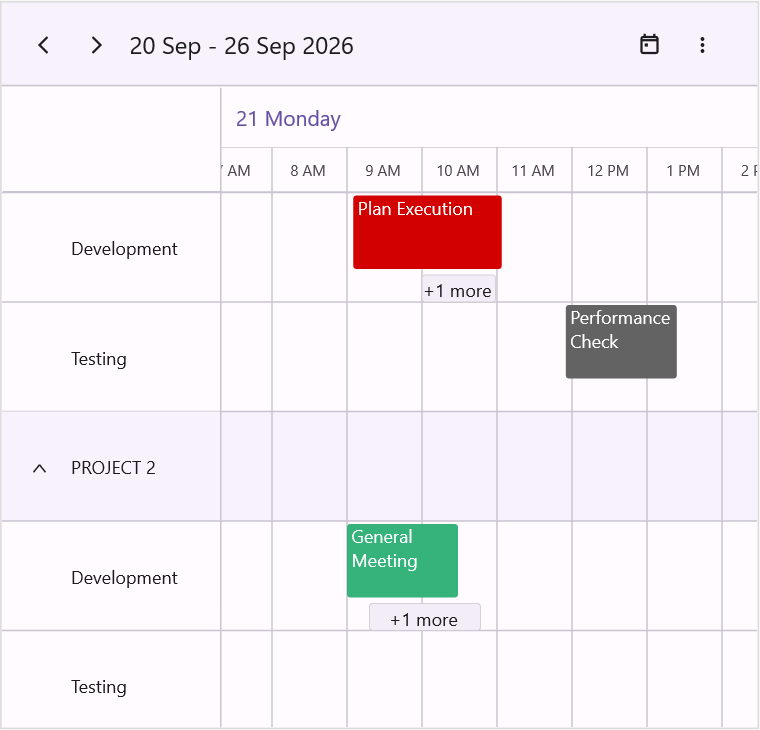
Hierarchical resource view
Resources can be organized and displayed in a hierarchical structure with parent-child relationships. This enhancement simplifies complex resource management and provides a clearer, more structured view of resources in scheduling.
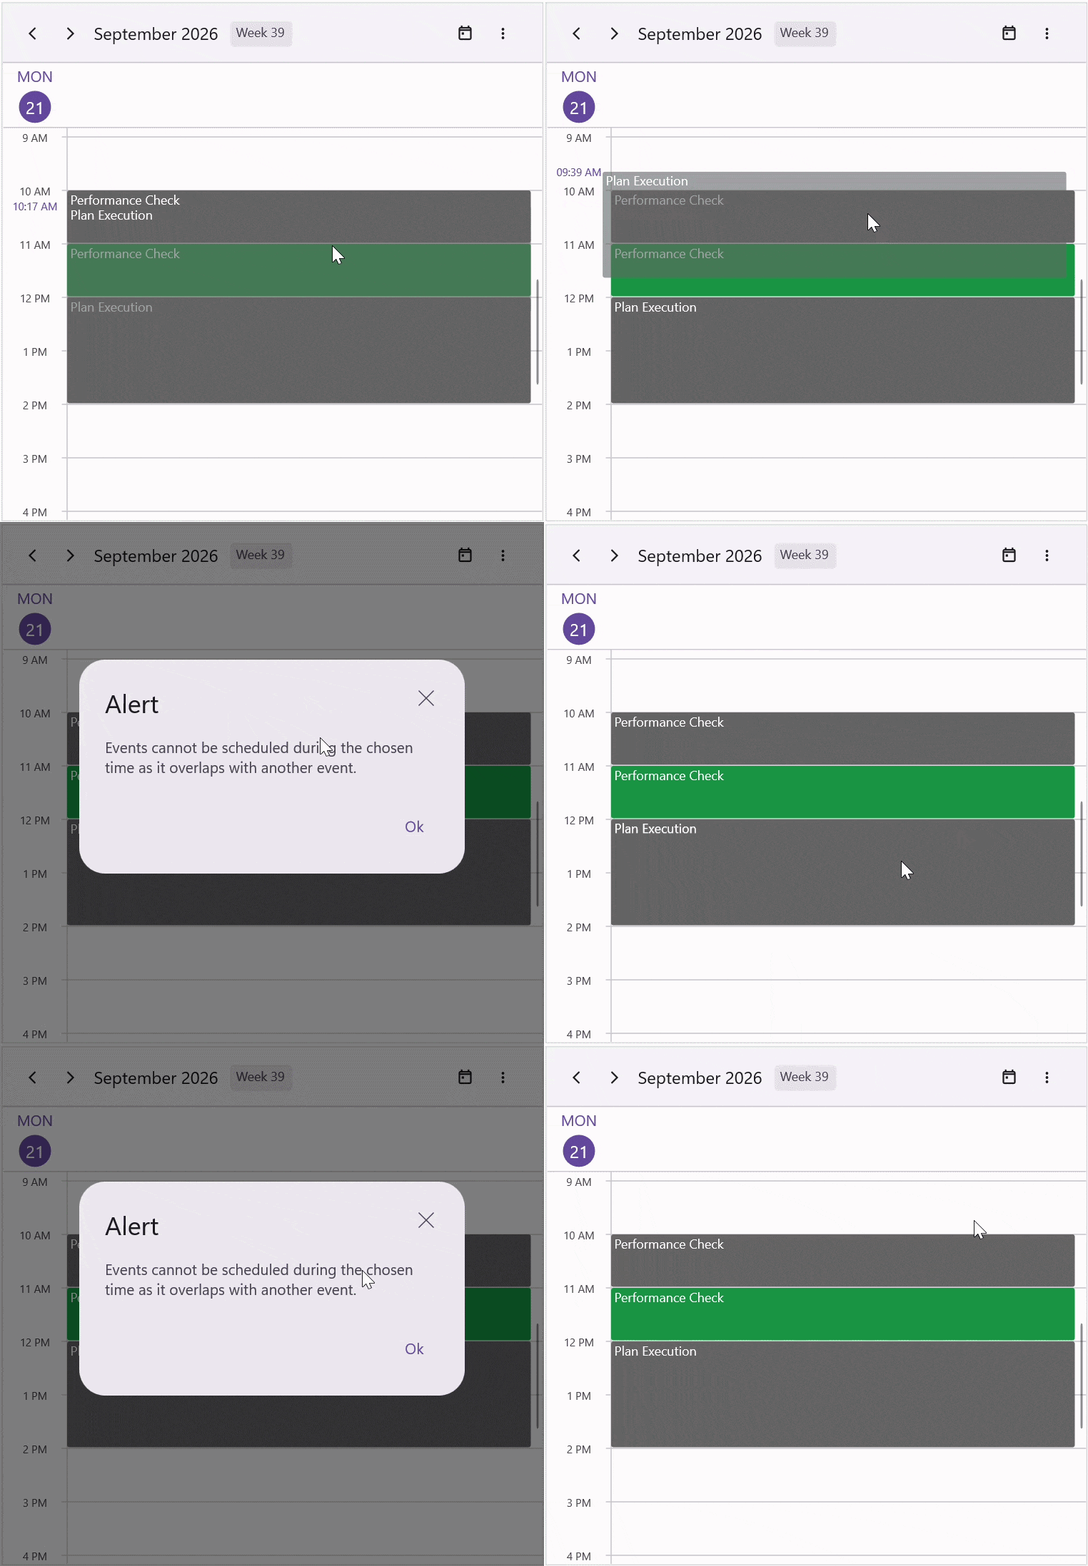
Restrict overlapping appointments
Prevent appointments from being scheduled within an already occupied time range to maintain conflict-free scheduling.
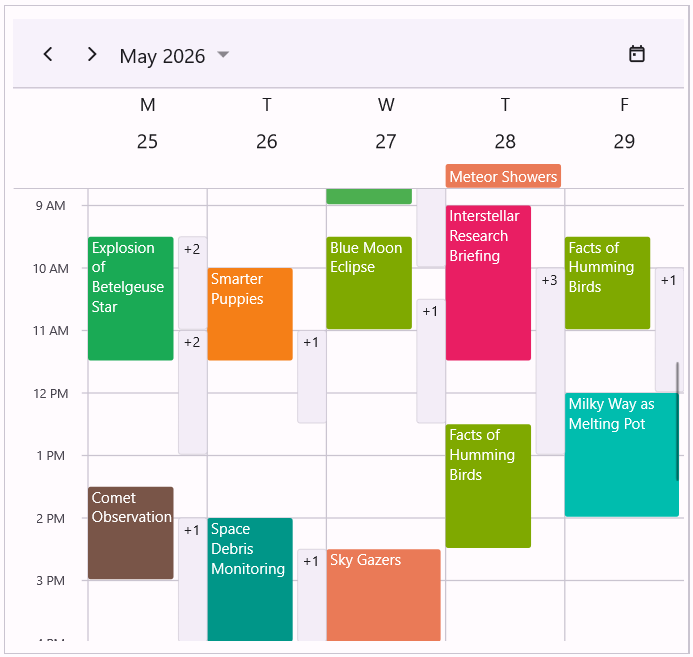
Limit concurrent appointments
Improve schedule readability in day, week, and workweek views by limiting the number of overlapping appointments displayed in each time slot.
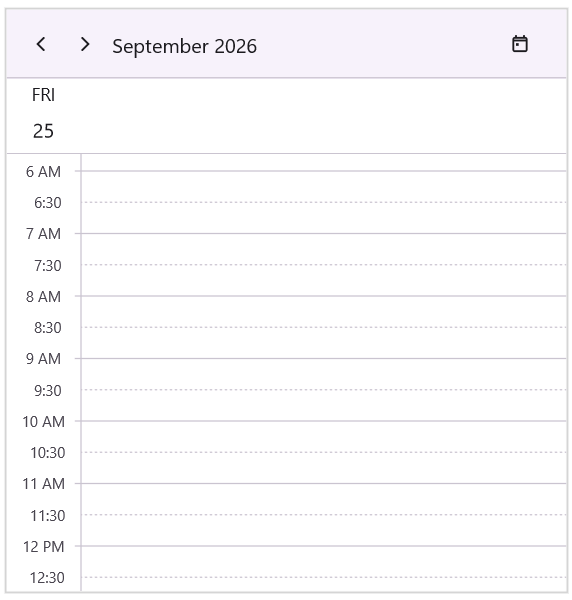
Major and minor time slot ticks
Display major and minor time slot ticks in day, week, workweek, and timeline views to improve time-slot visualization and scheduling accuracy.
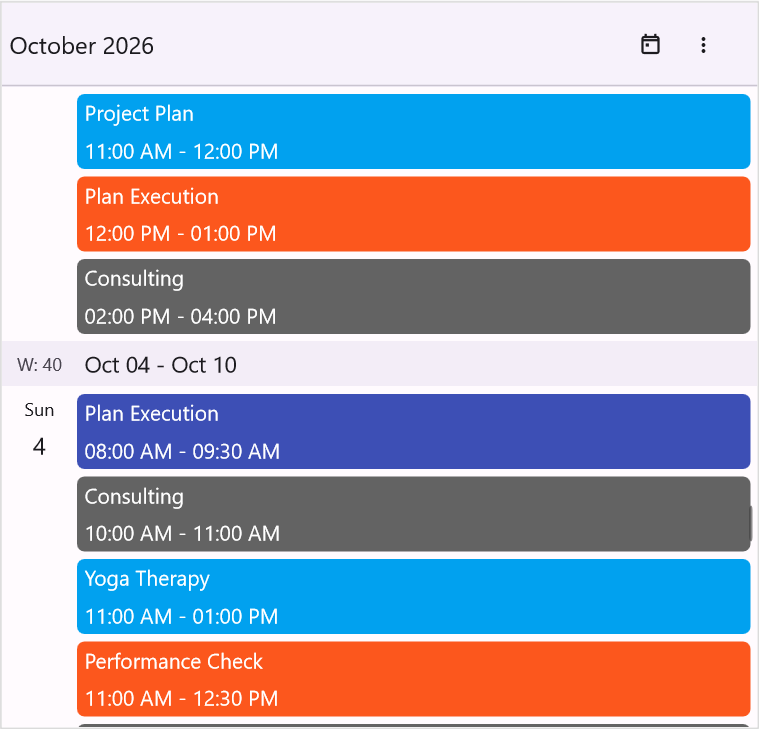
Week numbers
Display week numbers directly in the Scheduler’s Timeline Month and Agenda views for easier week-based planning and navigation.
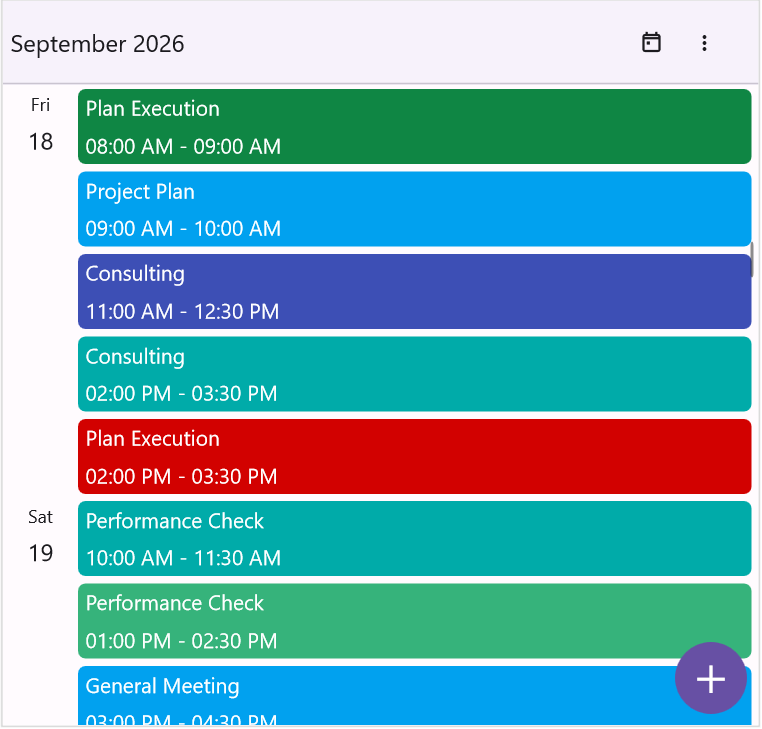
Built-in floating action button
Enable a floating action button in the Scheduler to provide quick access to appointment creation, resulting in a more intuitive, mobile-friendly scheduling experience.
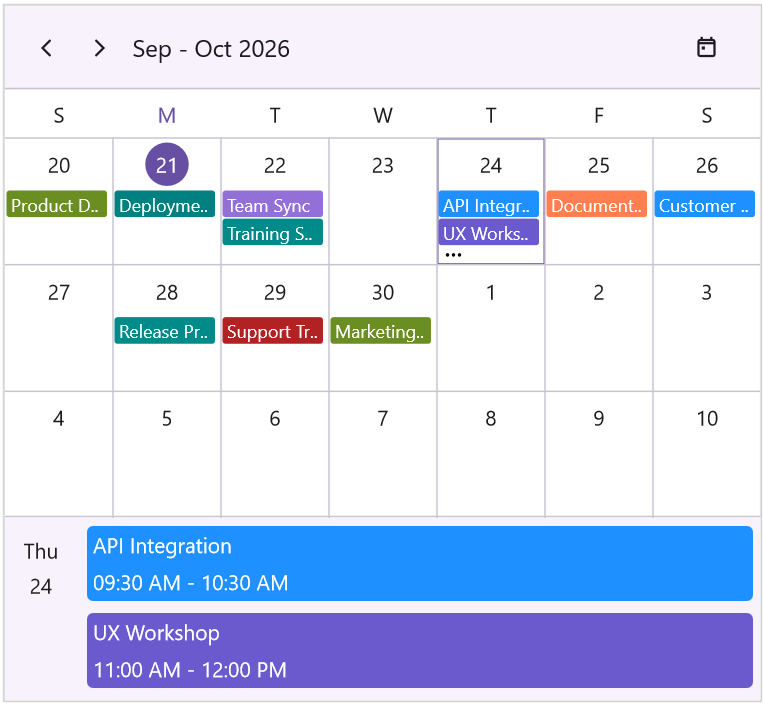
Month agenda view
View the selected day’s appointments directly in the month view through an integrated agenda panel, making it easier to review schedules without switching views.
Adaptive resource layout
Enable an adaptive resource view on desktop platforms, allowing the Scheduler to use a mobile-style navigation drawer for a consistent and responsive resource-browsing experience across devices.
Auto resource row height
Control resource row sizing in Scheduler timeline views by disabling automatic row-height adjustment to keep the layout cleaner and better handle overlapping appointments.
Import and export ICS files
Import and export appointments to and from iCalendar (.ics) files, making it easier to exchange scheduling data with other calendar applications.

Do you have a feature request? Post the details in the feedback portal.







