- Home
- Forum
- Angular - EJ 2
- DateTimeAxis with intervalType 'Hours' does not work
DateTimeAxis with intervalType 'Hours' does not work
I'm trying to generate a line chart for a 24hr data but couldn't see the graph in the chart. My data points look like below (printed to console and copied from i)
- 0: {x: 78.15, y: "2019-02-20T17:38:48"}
- 1: {x: 77.38, y: "2019-02-20T17:53:54"}
- 2: {x: 76.69, y: "2019-02-20T18:08:59"}
- 3: {x: 76.55, y: "2019-02-20T18:24:05"}
- 4: {x: 76.51, y: "2019-02-20T18:39:12"}
- 5: {x: 76.5, y: "2019-02-20T18:54:18"}
- 6: {x: 76.51, y: "2019-02-20T19:09:23"}
- 7: {x: 76.51, y: "2019-02-20T19:24:31"}
- 8: {x: 76.57, y: "2019-02-20T19:39:39"}
- 9: {x: 76.55, y: "2019-02-20T19:54:43"}
- 10: {x: 76.55, y: "2019-02-20T20:09:47"}
- 11: {x: 76.57, y: "2019-02-20T20:24:54"}
- ...
- 100: {x: 67.50, y: "2019-02-20T17:38:48"}
public primaryXAxis: Object = {
valueType: 'DateTime',
labelFormat: 'hh:mm',
intervalType: 'Hours',
interval: 4,
majorGridLines: { width: 0 },
minimum: moment().subtract({ hours: 24 }).format(),
maximum: moment.now()
};
//Initializing Primary Y Axis
public primaryYAxis: Object = {
labelFormat: '{value}°F',
rangePadding: 'None',
minimum: 70,
maximum: 100,
interval: 5,
lineStyle: { width: 0 },
majorTickLines: { width: 0 },
minorTickLines: { width: 0 }
};
public chartArea: Object = {
border: {
width: 0
}
};
public width: string = '100%';
public marker: Object = {
visible: true,
height: 10,
width: 10
};
public tooltip: Object = {
enable: true
};
public load(args: ILoadedEventArgs): void {
let selectedTheme: string = location.hash.split('/')[1];
selectedTheme = selectedTheme ? selectedTheme : 'Material';
args.chart.theme = <ChartTheme>(selectedTheme.charAt(0).toUpperCase() + selectedTheme.slice(1)).replace(/-dark/i, "Dark");
};
public title: string = 'Device Data Chart';
<ejs-chart style='display:block; align-items:center' id='chartcontainer' [title]='title' [primaryXAxis]='primaryXAxis' [primaryYAxis]='primaryYAxis'
[tooltip]='tooltip' (load)='load($event)' [chartArea]='chartArea' [width]='width'>
<e-series-collection>
<e-series [dataSource]='chartData' type='Line' xName='x' yName='y' name='Datetime' width=2 [marker]='marker'> </e-series>
</e-series-collection>
</ejs-chart>

SIGN IN To post a reply.
3 Replies
KC
Kalaimathi Chellaiah
Syncfusion Team
February 22, 2019 12:51 PM UTC
Hi Aparna,
Greetings from Syncfusion.
We have analyzed your query. We have prepared a sample using attached code snippet. In that snippet you have mentioned x axis value type as DateTime. But in attached data x contains numeric value and y contains date time value. So kindly bind the xName as y and yName as x in series. Also check the minimum and maximum range in primaryxAxis.
Screenshot:
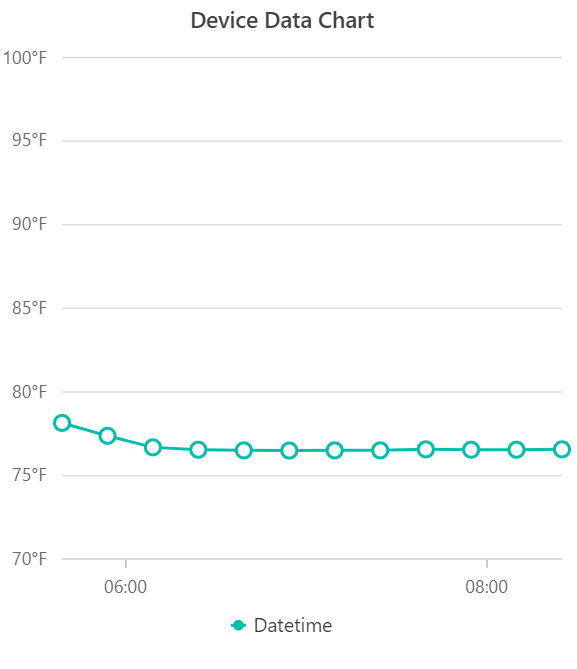
Kindly check that above sample and revert us back still issue will be exist.
Regards,
Kalai.
AP
Aparna Pyla
February 22, 2019 05:21 PM UTC
Thank you. It works now. Appreciate your quick response.
DD
Dharanidharan Dharmasivam
Syncfusion Team
February 25, 2019 04:12 AM UTC
Hi Aparna,
Most welcome. Kindly get in touch with us, if you need further assistance. We are always happy in assisting you.
Thanks,
Dharani.
SIGN IN To post a reply.
- 3 Replies
- 3 Participants
-
AP Aparna Pyla
- Feb 21, 2019 11:57 PM UTC
- Feb 25, 2019 04:12 AM UTC

