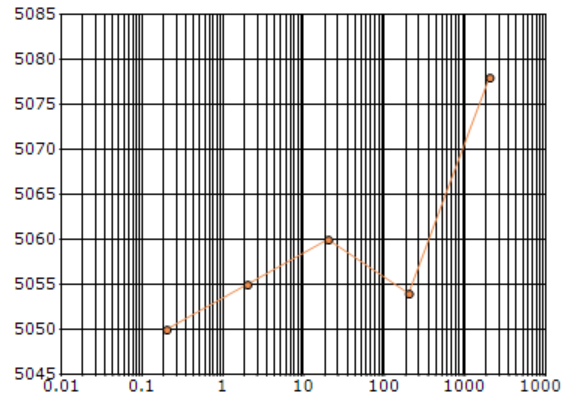
Scatter chart with lines connecting adjacent points
I would like to modify the style of the scatter chart so that a smooth curve is produced. Attached is a sample of what I am expecting to produce. Is this possible with Syncfusion Charting component?
I would also like to produce a logarithmic horizontal axis with bounds at a minimum range of 0.2 (value) and a maximum range of 2000.0 (value), scaled logarithmically, but I want the minor grid to follow the values, not put the major ticks at 0.2, 2.0, 20.0, 200.0, and 2000.0, as it tries to do automatically. I still want the major ticks at 1.0, 10.0, 100.0, and 1000.0, and minor grid in the proper places, as in the attached screen shot. The only way I found to do this was to change the minimum to 0.1 so that the major ticks would fall correctly, as in the component on the left.
Thanks for your assistance.
Attachment: SfComparison_3e2c8f89.zip
SIGN IN To post a reply.
4 Replies
DD
Dharanidharan Dharmasivam
Syncfusion Team
August 25, 2016 05:14 PM UTC
Hi Michael,
Thanks for using Syncfusion product.
We have analyzed your query. Style of the scatter chart can be customized using ScatterConnectType property in order to get smooth curve. Set line type to ScatterConnectType property, so that the each points will be connected with the line to get smooth curve. Find the code snippet below,
Code snippet:
| Windows Forms: series.ScatterConnectType = ScatterConnectType.Line; |
Screenshot:
If you set the minimum range then chart will render from the minimum value only and based on the intervals the next labels will be calculated, the default value of interval is 1.If you not set the range, then by default it will start from 0.1 and also depends upon the minimum x value in the series, the chart will render. For example if you set the minimum value as 0.2, the next label will be 2 since the default value of interval is 1, this is the behavior.
For your reference we have attached the sample. Kindly find the sample from the below link,
Sample Link: https://www.syncfusion.com/downloads/support/forum/125560/ze/logarithmic_Sample782815199
Kindly revert us if you have any concern.
Thanks,
Dharani.
MR
Michael Rovak
August 25, 2016 05:53 PM UTC
Thanks for your quick reply.
Yes, the ScatterConnectType works perfectly, that's exactly what I wanted.
However, I suggest that your engineers rethink your position on the logarithmic axes. I expect to have control over the range to suit a particular presentation that is expected in my vertical market space, and I would expect your logarithmic axes to be a little smarter than to ignore the values being plotted and where they are, and then move the major and minor ticks to match the actual expected location of the data, as illustrated with the correct expected behavior in the plot on the left side of my screenshot.
If my minimum is 0.2, then I expect the minor grid to match my 0.2, and the next major label or grid position to be at 1.0 regardless of my minimum setting. I think this has something to do with how you use the number of minor ticks between the major ticks. If I change the minimum, then you need to detect that and skip 1 minor tick, and all should then be well as I expect it.
But thanks for your kind assistance.
MR
Michael Rovak
August 25, 2016 06:19 PM UTC
Just to be clear, my point is that regardless of how I set the maximum and minimum limits for a display, a logarithmic axis in base 10 needs to ALWAYS place major ticks and grid lines on an even decade (0.1, 1.0, 10.0, 100.0, etc.).
If I set the minimum at 0.2, then the system needs to NOT render the 0.1 decade which is now off the scale, and continue with 0.3, 0.4, .. 1.0 where the first major tick and grid line appears. Then, the display will remain quantitatively correct under all circumstances.
Thanks for listening.
If I set the minimum at 0.2, then the system needs to NOT render the 0.1 decade which is now off the scale, and continue with 0.3, 0.4, .. 1.0 where the first major tick and grid line appears. Then, the display will remain quantitatively correct under all circumstances.
Thanks for listening.
DD
Dharanidharan Dharmasivam
Syncfusion Team
August 26, 2016 11:17 AM UTC
Hi Michael,
Thanks for your update.
As stated early, this is our current behavior, so we have created a feature request for your requirement. And also a support incident to track the status of this feature has been created under your account.
Thanks,
Dharani.
SIGN IN To post a reply.
- 4 Replies
- 2 Participants
-
MR Michael Rovak
- Aug 24, 2016 10:51 PM UTC
- Aug 26, 2016 11:17 AM UTC
