How to get rid of empty areas at top and bottom of chart ?
Attachment: text.Results.svg_e5d21b7f.rar
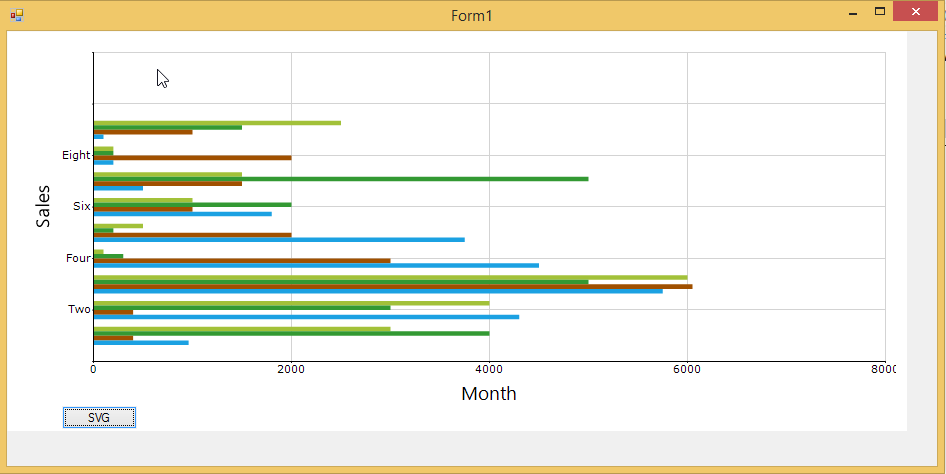
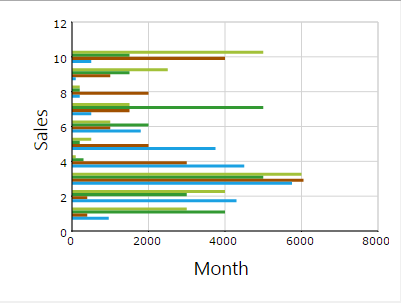
Thanks for contacting Syncfusion support. We have analyzed your query and replicated the scenario in our sample. But we can’t reproduce the reported issue. Chart is exported exactly like how it is rendered. Please find the below screenshot of the chart while rendering.
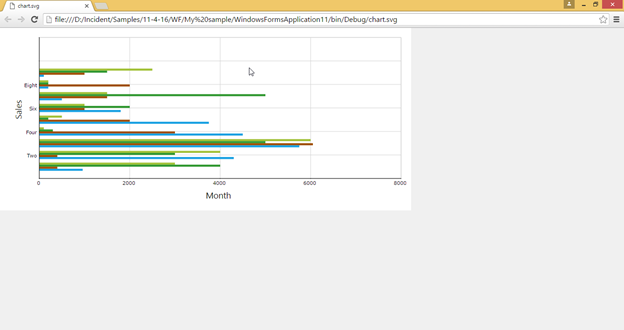
If the export button is clicked, then chart is exported to SVG. Please find the below screenshot, while export the chart to SVG
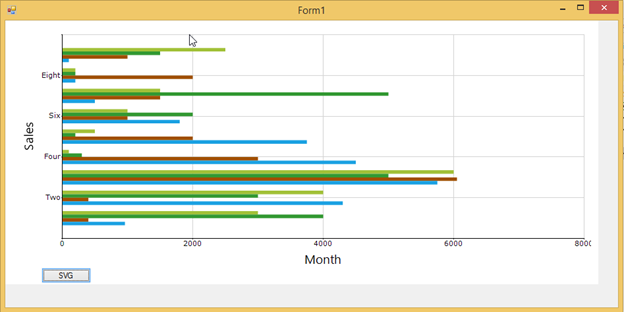
Space given at the top of the chart may occur because of “RangePadding”. Please ensure whether you have set “RangePaddingType” as “Calculate”. Because this “RangePadding” will add one more interval space at the top of chart. To avoid this space, please set the “RangePaddingType” as “None” for primaryYAxis. Please follow the below code example.
[CS]
| chart.PrimaryYAxis.RangePaddingType = ChartAxisRangePaddingType.None; |
Now the chart will render like below.
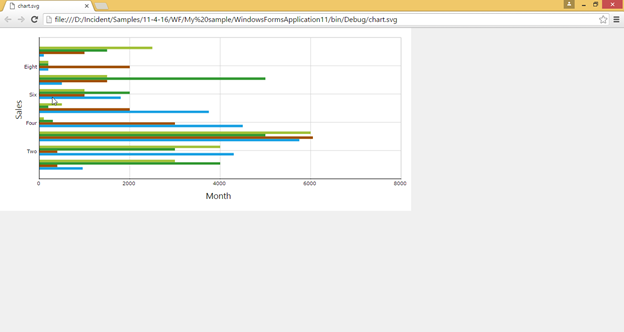
Please find the below screenshot, while exporting the chart to SVG format.
In the below link, we have attached sample for your reference.
Sample link: https://www.syncfusion.com/downloads/support/forum/123674/ze/Sample-1380658607
If you still face any concern, kindly let us know by modifying the attached sample along with replication procedure. Or please provide the sample in which reported issue is reproduced. This will be helpful for us to find and fix the issue sooner.
Regards,
Sanjith.
Attachment: text.Results.svg_667594b2.rar
Attachment: scans.Results.svg_f6efe709.rar
Attachment: popular.Results.svg_d87543ac.rar
Hi Oleg, If the padding is not added, then some of the bars will be clipped. In your case, very large space is added at the top and the bottom. This issue is not reproduced at our end. In the below link, we have attached the sample for your reference. Please revert us the modified sample along with the replication procedure and detail about your current Essential Studio version to reproduce the reported issue, or else please provide us the sample in which the reported issue is reproduced. Regards, Sanjith.
We have analyzed your query and replicated the scenario in our sample. If we add new point at the top of the chart for avoid clipping of the bar, padding is added at the top of the chart. Please find the below screenshot before adding the point at the top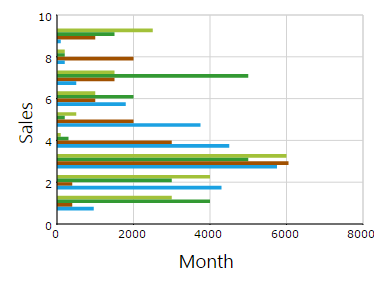
Screenshot of the chart after adding point at the top.
Sample link: https://www.syncfusion.com/downloads/support/forum/123674/ze/Console_application1258860913
- 5 Replies
- 2 Participants
-
OS OSubachev
- Apr 9, 2016 06:48 AM UTC
- Apr 13, 2016 12:31 PM UTC
