

The WinUI 3 DataGrid control is used to display data in a tabular format. It has all the features that an essential data grid control should have. Create feature-rich data tables with Syncfusion WinUI DataGrid. Easily add sorting, filtering, editing, paging, and export options to your WinUI apps.
Let’s look at the top 10 features of the WinUI DataGrid control that enhance data visualization and handling:
- Different column types
- Sorting
- Grouping
- Filtering
- Summaries
- Selection
- Editing
- Autofit rows and columns
- Master-details view
- Performance
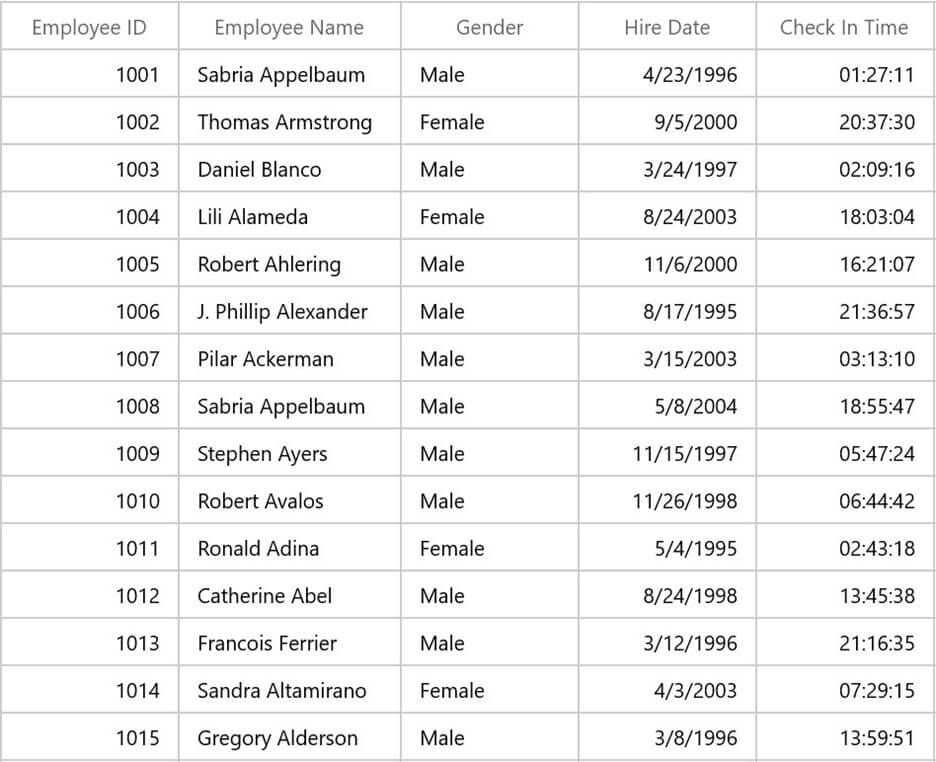
Different types of columns
The WinUI DataGrid supports the following built-in column types to easily edit the values in its cells:
- Text column
- Numeric column
- Date column
- Time column
- Combo box column
- Checkbox column
- Hyperlink column
- Image column
- Toggle switch column
- Template column
- Unbound column
- Check box selector column
The DataGrid automatically generates the columns based on the type of data object bound to it. Each column has its own properties to handle different types of data. Also, we can manually create the columns and add them to the DataGrid.
The appropriate editors will be loaded when editing the values in a cell as per the column’s data type.
Note: For more details, refer to the column types in WinUI DataGrid documentation.
Sorting
Sort by a single column by clicking or tapping on the column header. We can also sort by multiple columns by holding Ctrl and clicking or tapping other column headers which will then be sorted against the previously sorted column. The DataGrid sorts data in ascending or descending order.
We can rearrange the data to its initial unsorted order by using tri-state sorting. Also, we can enable or disable the sorting feature for specific columns.
Refer to the following GIF image.
Note: For more details, refer to the sorting in WinUI DataGrid documentation.
Grouping
This feature allows you to group the data against one or more columns, either through mouse and touch interaction in the group drop area, or through the code behind. Also, we can group the data with custom logic.
Refer to the following GIF image.
Note: For more details, refer to the grouping in WinUI DataGrid documentation.
Filtering
Filtering is the process of retrieving values from the data collection that satisfy specific conditions. In our DataGrid, you can filter the data through the UI and programmatically. UI filtering provides both checkbox and advanced filtering options. Based on the underlying data type, the filter dialog will be displayed. The DataGrid supports TextFilter, NumberFilter, and DateFilter options. Also, you can enable or disable filtering for specific columns.
Note: For more details, refer to the filtering in WinUI DataGrid documentation.
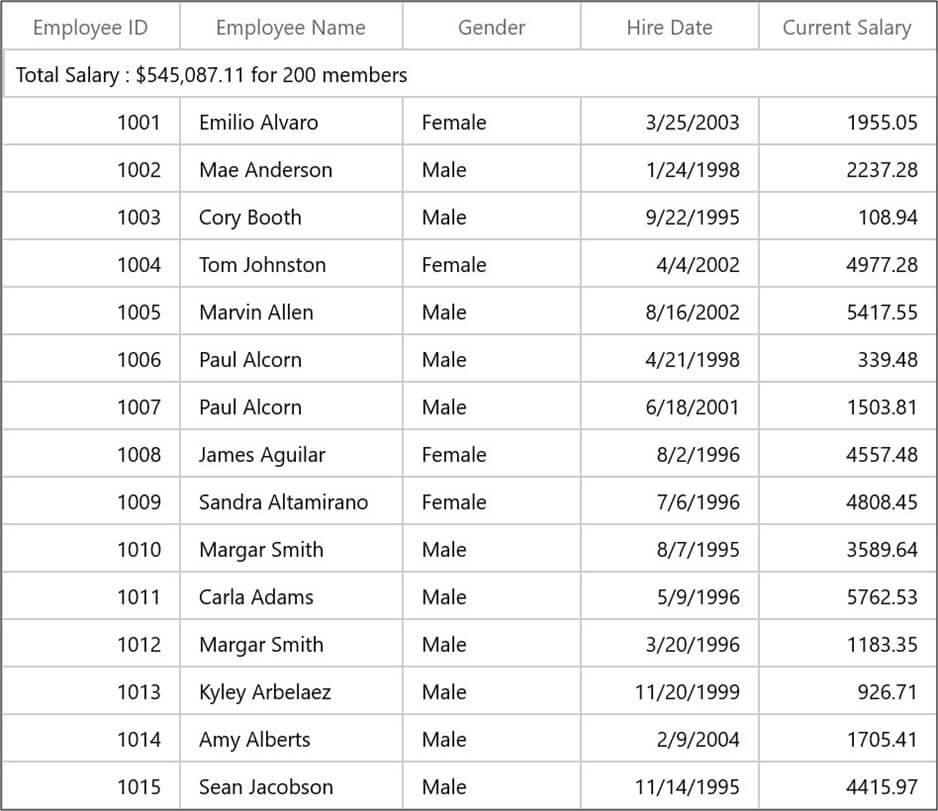
Summaries
This feature enables users to show an additional unbound row to display a summary or total value. Users can also use summaries to display minimum, maximum, average, and count values for a column. The DataGrid supports the following summary rows:
- TableSummary: Display summary information of the grid either at the top or bottom.
- GroupSummary: Display summary information of data objects in each group.
- CaptionSummary: Display summary information in the caption of a group.
Note: For more details, refer to the summaries in WinUI DataGrid documentation.
Selection
This feature allows you to select one or more rows or cells in the DataGrid. When you click on a cell, the entire row will be selected.
Refer to the following GIF image.
Note: For more details, refer to the selection in WinUI DataGrid documentation.
Editing
You can edit cell values through the UI or programmatically. The object editor will load in edit mode based on the type of underlying data. Also, we can enable or disable editing for a particular column alone.
Note: For more details, refer to the editing in WinUI DataGrid documentation.
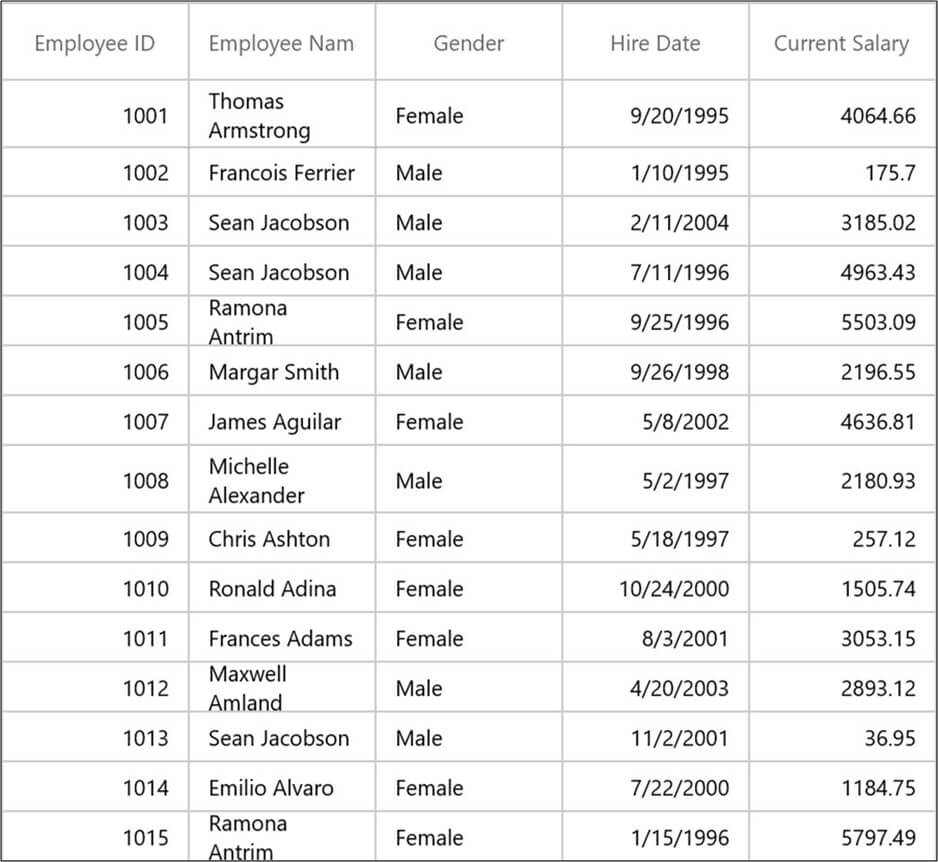
Autofit rows and columns
The WinUI DataGrid provides support to automatically fit the row height and column width based on the content size to enhance the readability of data.
Note: For more details, refer to the auto-size columns and row height customization in WinUI DataGrid documentations.
Master-details view
Represent hierarchical data in the form of nested tables using the master-details view. You can expand or collapse the nested tables by using an expander UI in a row or programmatically. The DataGrid generates the relationships among the parent and nested grids by default. We can also manually generate the relationships among the grids if desired.
Refer to the following code example.
<dataGrid:SfDataGrid x:Name="dataGrid"
        AutoGenerateColumns="True"
        AutoGenerateRelations="False"
        ItemsSource="{Binding Employees}">
    <dataGrid:SfDataGrid.DetailsViewDefinition>
        <!--  FirstLevelNestedGrid1 is created here  -->
        <dataGrid:GridViewDefinition RelationalColumn="Sales">
            <dataGrid:GridViewDefinition.DataGrid>
                <dataGrid:SfDataGrid x:Name="FirstLevelNestedGrid1"
                        AutoGenerateColumns="True"/>
            </dataGrid:GridViewDefinition.DataGrid>
        </dataGrid:GridViewDefinition>
        <!--  FirstLevelNestedGrid2 is created here  -->
        <dataGrid:GridViewDefinition RelationalColumn="Orders">
            <dataGrid:GridViewDefinition.DataGrid>
                <dataGrid:SfDataGrid x:Name="FirstLevelNestedGrid2"
                        AutoGenerateColumns="True"/>
            </dataGrid:GridViewDefinition.DataGrid>
        </dataGrid:GridViewDefinition>
    </dataGrid:SfDataGrid.DetailsViewDefinition>
</dataGrid:SfDataGrid>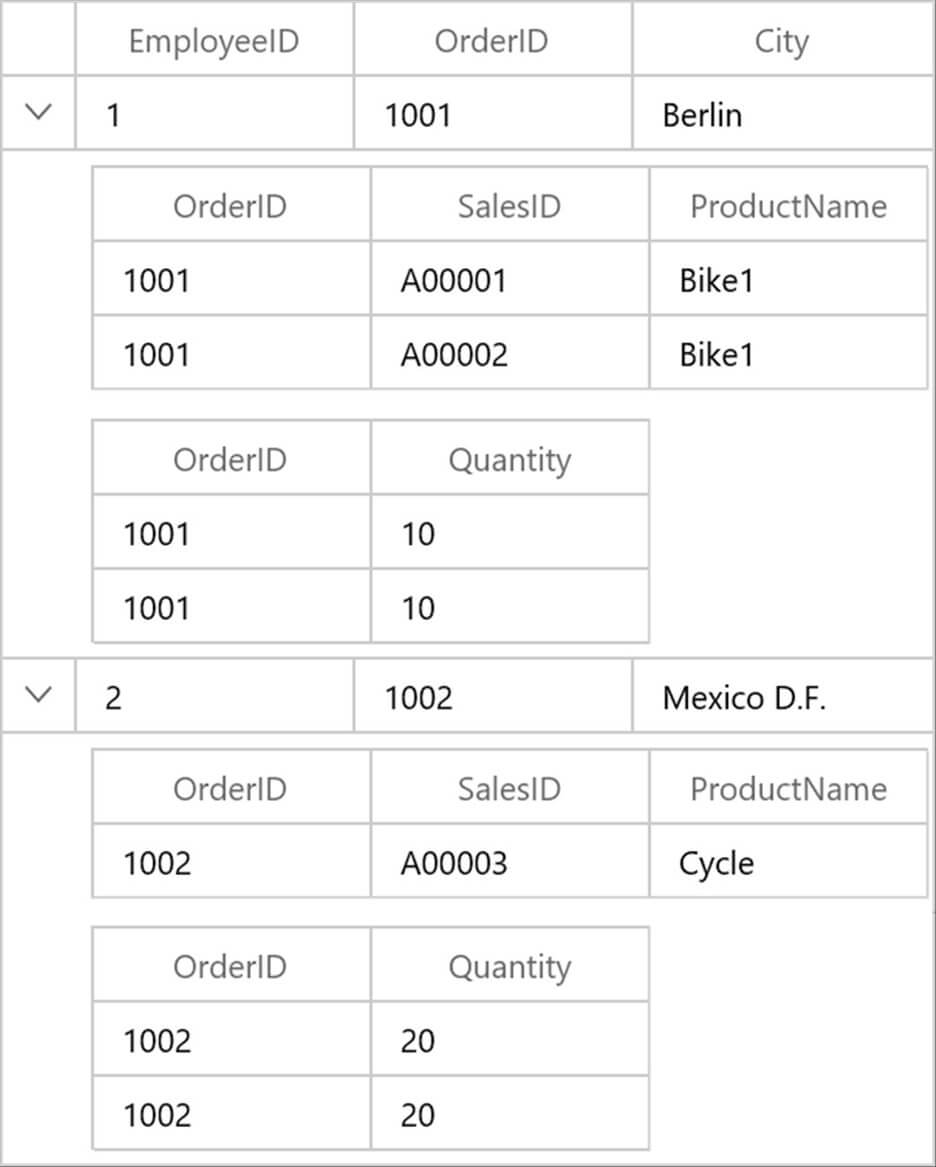
Note: For more details, refer to the master-details view in WinUI DataGrid documentation.
Performance
The DataGrid provides various built-in options to enhance performance while handling a huge volume of data. You can load the data in less time using the data virtualization feature. With the batch update feature, users can efficiently add, remove, and update huge numbers of records along with the sorting, grouping, and summaries features.
Note: For more details, refer to the performance in WinUI DataGrid documentation.
Conclusion
Thanks for reading! In this blog post, we have seen the top 10 features of the WinUI DataGrid for better data visualization and handling. The DataGrid also provides data binding, error indication and validation, conditional formatting, and more. Try out this versatile DataGrid control and leave your feedback in the comments section below!
Browse our WinUI documentation for complete details about all our WinUI controls, and don’t miss our demos in the Microsoft Store and GitHub.
For current customers, the newest version is available for download from the License and Downloads page. If you are not yet a Syncfusion customer, you can try our 30-day free trial to check out the newest features.
Also, you can reach us through our support forums, support portal, or feedback portal. As always, we are happy to assist you!
 No spam, just valuable updates.