
Our Syncfusion React Gantt Chart component is a specialized chart tool that supports the customization of various Gantt elements such as timelines, taskbars, column headers, cells, labels, and tooltips.
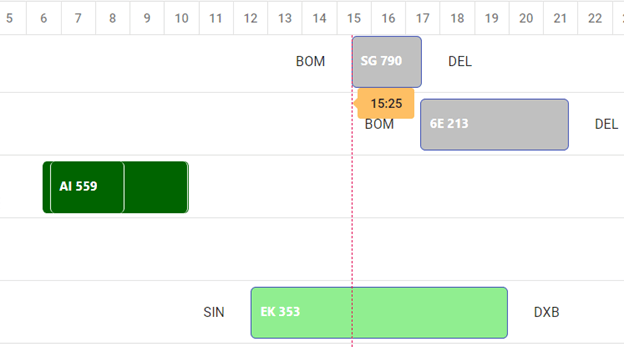
In this article, we’ll see how to customize these Gantt Chart elements to develop a flight tracker application. As we all know, flights are scheduled at different airports at different times. In this application, we are going to display all the scheduled fights and their live tracking status at different airports.
You can also check the status of each flight in detail by expanding each airport like in the following screenshot.
Customization of Gantt Chart elements
We are going to customize the following Gantt Chart elements to develop our flight tracker application:
Taskbar
The taskbar can be used to show different statuses like auto or manual, unscheduled or scheduled (parent, child, milestone). You can customize it using either the taskbarTemplate or queryTaskbarInfo client-side event.
Refer to the following code example.
// Based on the current time, validated the flights into three categories:
// 1. Completed journey – Denoted by green
// 2. In journey        - Denoted by light green
// 3. Not yet started   - Denoted by gray

taskbarTemplate(props) {
        var startTime = props.ganttProperties.startDate.getTime();
        var endTime = props.ganttProperties.endDate.getTime();
        var currentTime = new Date('02/13/2021 15:25:00').getTime();
        if (endTime < currentTime) {
            return (
                <div className="e-gantt-child-taskbar-inner-div e-gantt-child-taskbar" style={{ height: "100%", borderRadius: "5px", backgroundColor: "#006400" }}>
                    {<div>
                        <span className="e-task-label" style={{ position: "absolute", zIndex: 1, top: "15px", fontFamily: "Segoe UI", fontSize: "12px", color: 'white', textOverflow: "ellipsis", overflow: "hidden" }}>
                            <b>{props.Name}</b></span>
                    </div>}

                </div>);
        } else if (startTime < currentTime) {
            return (
                <div className="e-gantt-child-taskbar-inner-div e-gantt-child-taskbar" style={{ height: "100%", borderRadius: "5px", backgroundColor: "#90EE90" }}>
                    {<div>
                        <span className="e-task-label" style={{ position: "absolute", zIndex: 1, top: "15px", fontFamily: "Segoe UI", fontSize: "12px", color: 'white', textOverflow: "ellipsis", overflow: "hidden" }}>
                            <b>{props.Name}</b></span>
                    </div>}

                </div>);

        } else {
            return (
                <div className="e-gantt-child-taskbar-inner-div e-gantt-child-taskbar" style={{ height: "100%", borderRadius: "5px", backgroundColor: "#C0C0C0" }}>
                    {<div>
                        <span className="e-task-label" style={{ position: "absolute", zIndex: 1, top: "15px", fontFamily: "Segoe UI", fontSize: "12px", color: 'white', textOverflow: "ellipsis", overflow: "hidden" }}>
                            <b>{props.Name}</b></span>
                    </div>}

                </div>);

        }
    };
Grid cells
You can customize the grid cells using the querycellinfo client-side event. The argument of this event will have the data, column, and cell element values. This event will be triggered before rendering each cell. Customize the cell elements of each cell in this event.
// Based on the current time, validated the flights into three categories:
    // 1. Completed journey   - Denoted by green
    // 2. In journey          - Denoted by light green
    // 3. Not yet started     - Denoted by gray
    queryCell(props) {
        if (!props.data.hasChildRecords && props.column.field == 'Name') {
            var startTime = props.data.ganttProperties.startDate.getTime();
            var endTime = props.data.ganttProperties.endDate.getTime();
            var currentTime = new Date('02/13/2021 15:25:00').getTime();
            if (endTime < currentTime) {
                props.cell.style.backgroundColor = '#006400';
            } else if (startTime < currentTime) {
                props.cell.style.backgroundColor = '#90EE90';
            } else {
                props.cell.style.backgroundColor = '#C0C0C0';
            }
        }
    }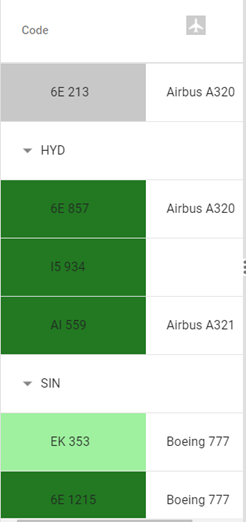
Header column
The header column can be customized by using the header template property. You can also render the HTML elements inside the template to customize the column header.
Refer to the following code.
<ColumnsDirective>
                    {/**Column header template*/}
                    <ColumnDirective field="Model" headerText='Flight' headerTemplate={() => {
                        return (<div style={{ marginLeft: "20px" }}><img src="./image/airplane.png" width="20" height="20" className="e-image" /></div>);
                    }} ></ColumnDirective>
                </ColumnsDirective>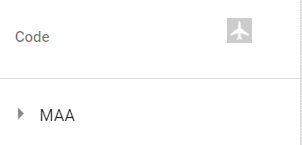
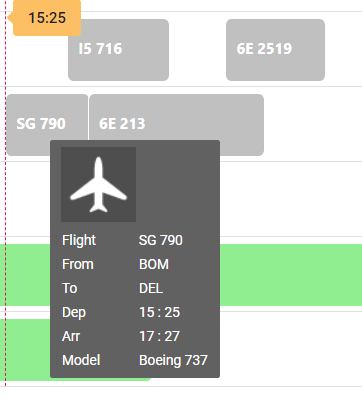
Tooltip
The Gantt Chart taskbar tooltip can also be customized using the template property. Get the Gantt data inside the template to render in the tooltip.
Refer to the following code.
// Template code for taskbar tooltip.
    tooltipTemplate(props) {
        var data = props.taskData;
        return (
            <table>
                <tr><img src="./image/airplane.png" ></img></tr>
                <tr><td>Flight</td><td>{data.Name}</td></tr>
                <tr><td>From</td><td>{data.From}</td></tr>
                <tr><td>To</td><td>{data.To}</td></tr>
                <tr><td>Dep</td><td>{data.Dep.getHours()} : {data.Dep.getMinutes()}</td></tr>
                <tr><td>Arr</td><td>{data.Arr.getHours()} : {data.Arr.getMinutes()}</td></tr>
                <tr><td>Model</td><td>{data.Model}</td></tr>
            </table>
        );
    }
GitHub sample
For more information, refer to the Flight tracker application using React Gantt Chart demo.
Conclusion
In this article, we have explained how to customize our Syncfusion React Gantt Chart component to develop a flight tracker application. Try out the ideas given in this blog post and leave your feedback in the comments section below. Refer to this sample browser and these documentation pages to learn more about our Gantt Chart’s features.
Our Gantt Chart is also available in our Blazor, ASP.NET (MVC and Web Forms), JavaScript, Angular, Vue, WPF, and UWP platforms. Use them to build astonishing web applications!
You can contact us through our support forum, Direct-Trac support system, or feedback portal. We are always happy to assist you!
If you liked this blog post, we think you’ll also like the following articles:
 No spam, just valuable updates.