WPF Gantt Control - Simplifying Project Scheduling
- Provide a project management tool with easy-to-understand task views and resource allocation.
- Schedule, manage, and monitor specific tasks and resources in a project effectively.
- Manage complex projects with an intuitive user interface.
.NET 10 support now available
Trusted by the world’s leading companies

Overview
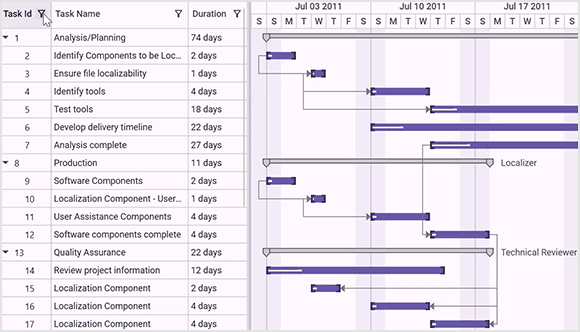
The WPF Gantt is a project management control that offers a Microsoft Project-like interface for displaying and managing hierarchical tasks and timelines. This control allows you to manage tasks, resources, and their relationships intuitively.
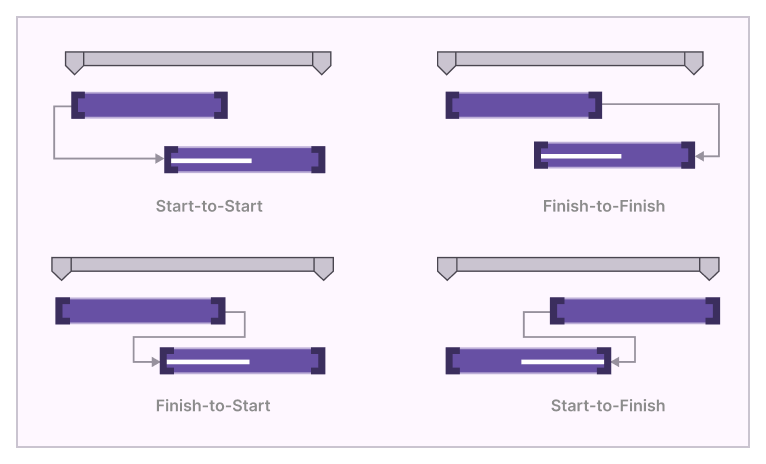
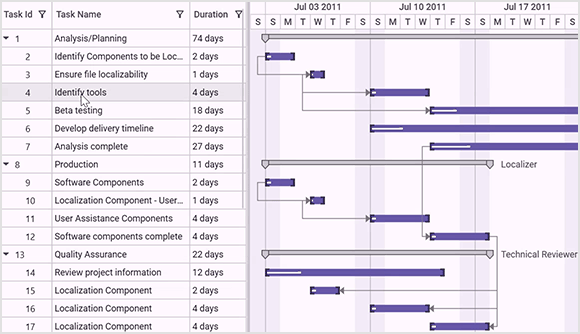
Task relationships
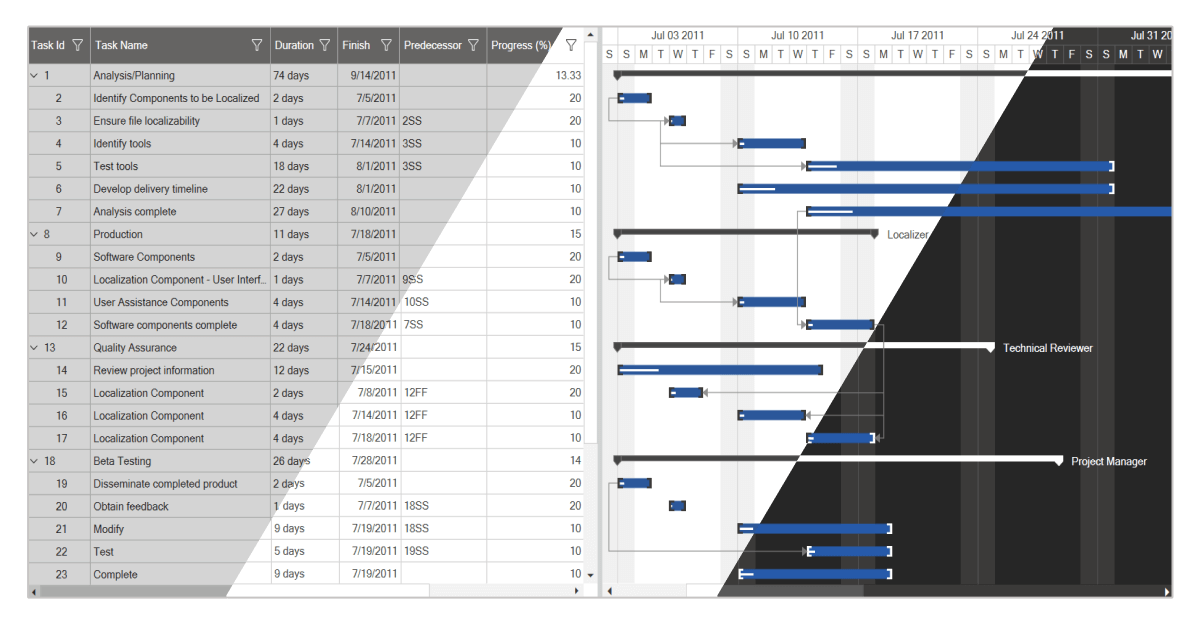
The WPF Gantt creates relationships among different tasks to determine the execution order using finish-to-start, start-to-finish, start-to-start, and finish-to-finish link types.
Data handling and manipulation
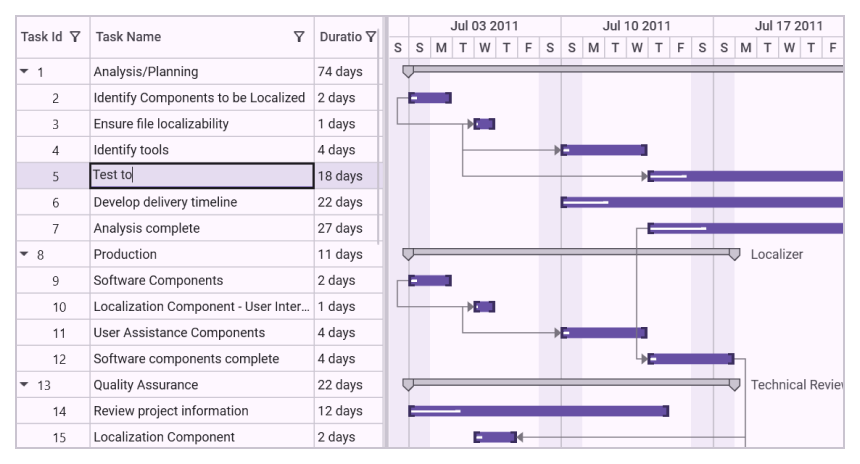
Editing
Edit task fields directly in their respective cells, such as duration, start date, end date, and predecessors, in the Gantt grid. Enable or disable Gantt editing operations using the read-only option.
Filtering
Data across all columns can be filtered using the menu filtering option.
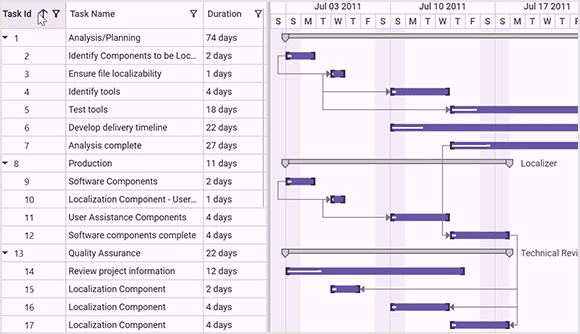
Sorting
The WPF Gantt control allows users to sort a column in either ascending or descending order by simply clicking on the header.
Interactive features
Row reordering
Users can easily reorder rows by dragging and dropping them within the Gantt control.
Zooming
Increase or decrease the width of timeline cells and change the timeline units dynamically with zooming. This allows you to clearly view tasks in a project, from years to minutes.
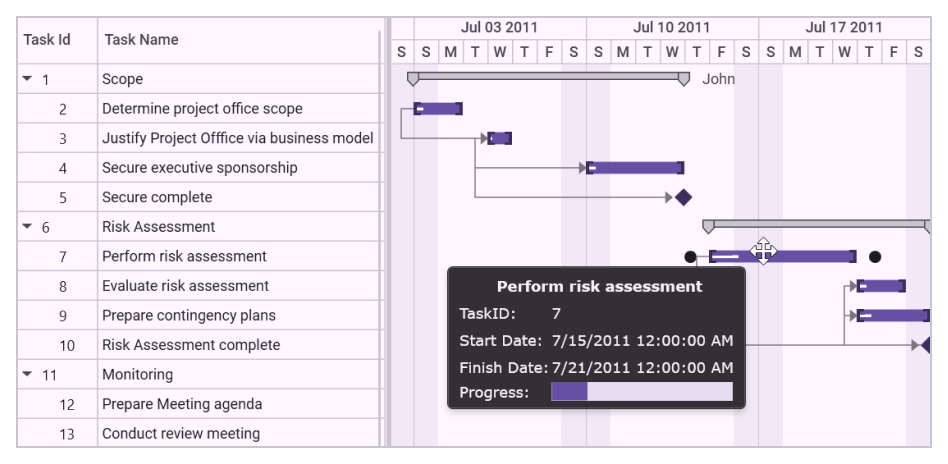
Tooltip
An interactive tooltip displays task information and editing actions when the mouse hovers over a task.
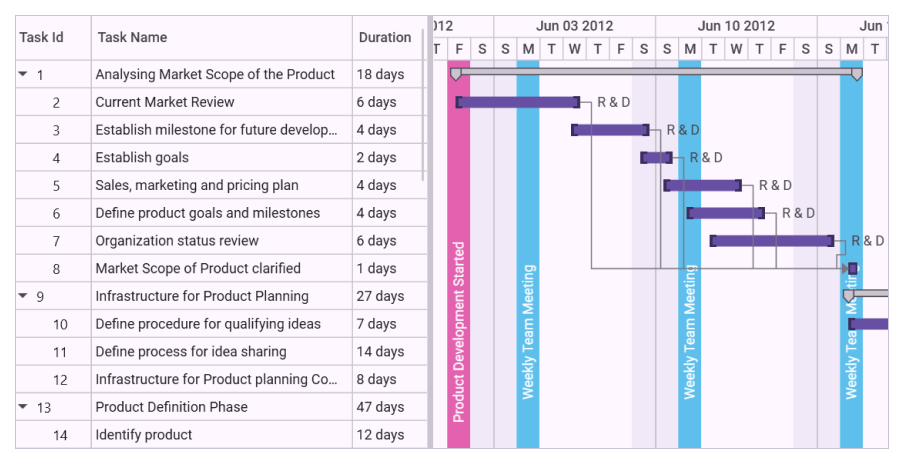
Strip lines
Easily identify important days and events in your project timeline by highlighting them with strip lines on the Gantt chart. You can also create strip lines for recurring dates.
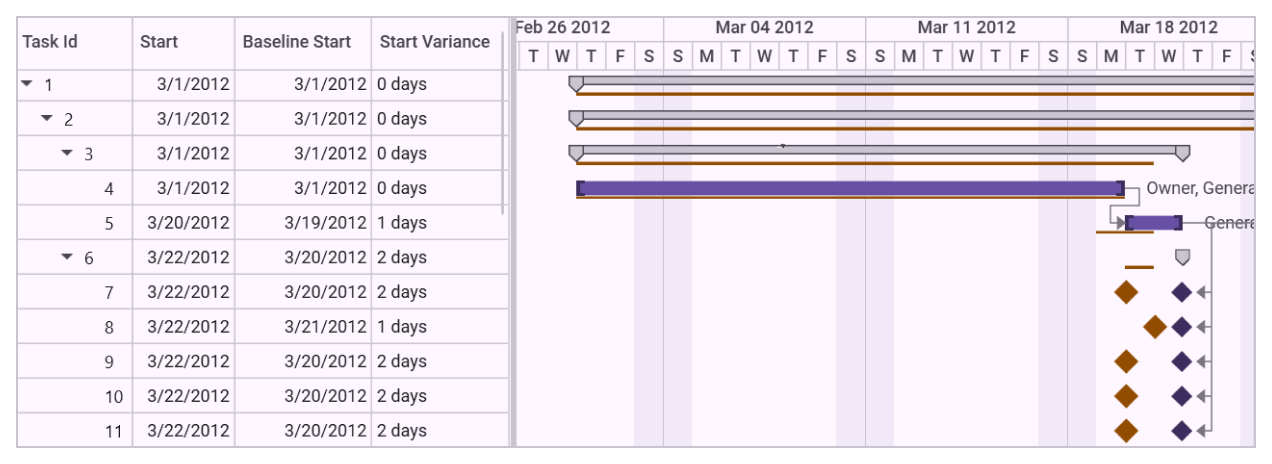
Baseline comparison
Compare the current task’s progress with the planned timeline using baselines.
Resource customization
Resource allocation
Allocate multiple resources to each task in the project view of the Gantt chart.
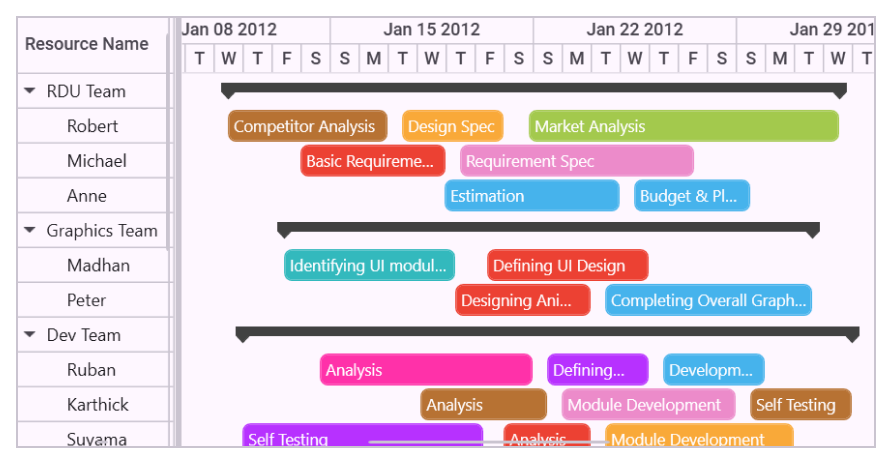
Resource view
In the resource view, tasks are hierarchically assigned to each resource, visualizing resources as parents and tasks as children. This structure provides a clear overview of resource allocation and task assignments within the project.
Themes
Unlock the power of visual appearance customization with the Gantt chart’s theming support. Users can effortlessly transform the appearance of their Gantt grid, Gantt schedule, and Gantt chart using a variety of built-in themes.
Exporting
Easily export the visible region or the entire Gantt chart in images formats such as JPEG, PNG, or BMP.
Microsoft Project compatibility
Effortlessly import and export XML file between the WPF Gantt control and Microsoft Project.
Data virtualization
Only data within the visible viewport renders, with more rendering when scrolled, improving performance even with large datasets.
WPF Gantt control code example
Easily get started with the WPF Gantt control using a few simple lines of XAML or C# code, as demonstrated in the following example. Also explore this WPF Gantt control example, which shows you how to render and configure the control.
xmlns:syncfusion="http://schemas.syncfusion.com/wpf"
<syncfusion:GanttControl ItemsSource="{Binding Tasks}">
    <syncfusion:GanttControl.DataContext>
        <local:GanttViewModel/>
    </syncfusion:GanttControl.DataContext>
</syncfusion:GanttControl>
public class GanttViewModel
{
public ObservableCollection<TaskDetails> Tasks { get; set; }
public GanttViewModel()
{
Tasks = this.GetTaskDetails();
}
private ObservableCollection<TaskDetails> GetTaskDetails()
{
ObservableCollection<TaskDetails> task = new ObservableCollection<TaskDetails>();
task.Add(
new TaskDetails
{
TaskId = 1,
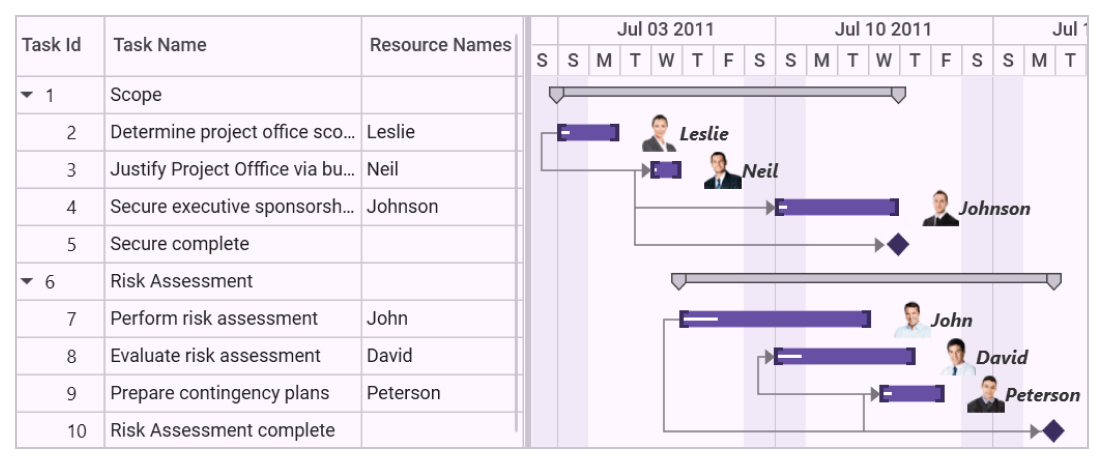
TaskName = "Scope",
StartDate = new DateTime(2011, 1, 3),
FinishDate = new DateTime(2011, 1, 14),
Progress = 40d
});
task[0].Child.Add(
new TaskDetails
{
TaskId = 2,
TaskName = "Determine project office scope",
StartDate = new DateTime(2011, 1, 3),
FinishDate = new DateTime(2011, 1, 5),
Progress = 20d
});
task[0].Child.Add(
new TaskDetails
{
TaskId = 3,
TaskName = "Justify project office via business model",
StartDate = new DateTime(2011, 1, 6),
FinishDate = new DateTime(2011, 1, 7),
Duration = new TimeSpan(1, 0, 0, 0),
Progress = 20d
});
task[0].Child.Add(
new TaskDetails
{
TaskId = 4,
TaskName = "Secure executive sponsorship",
StartDate = new DateTime(2011, 1, 10),
FinishDate = new DateTime(2011, 1, 14),
Duration = new TimeSpan(1, 0, 0, 0),
Progress = 20d
});
task[0].Child.Add(
new TaskDetails
{
TaskId = 5,
TaskName = "Secure complete",
StartDate = new DateTime(2011, 1, 14),
FinishDate = new DateTime(2011, 1, 14),
Duration = new TimeSpan(1, 0, 0, 0),
Progress = 20d
});
return task;
}
}Not sure how to create your first WPF Gantt chart? Our documentation can help.
I’d love to read it nowFrequently Asked Questions
Why should you choose the Syncfusion WPF Gantt chart?
- A complete project management tool to schedule and plan projects.
Ability to manage and monitor specific tasks and resources in a project.
- Intuitive user interface to manage complex projects.
- Simple configuration and API.
- Touch-friendly and responsive UI.
Extensive demos and documentation let you get started quickly with WPF Gantt chart.
Can I download and utilize the Syncfusion WPF Gantt chart for free?
No, this is a commercial product and requires a paid license. However, a free community license is also available for companies and individuals whose organizations have less than $1 million USD in annual gross revenue, 5 or fewer developers, and 10 or fewer total employees.
How do I get started with the Syncfusion WPF Gantt chart?
A good place to start would be our comprehensive getting started documentation.
Our Customers Love Us
Having an excellent set of tools and a great support team, Syncfusion® reduces customers’ development time.Here are some of their experiences.

Satisfying components with great community support.
It solves a lot. I mostly use its Kanban control and Grid control with no problems. It has a great ui design and design options. It made it easy for us to build a warehouse management system.

Muhammed Y.

Co-Founder - Full-Stack Developer
Great Community Program and Pro Components for Building New Solutions
Having gantt component ready to use, helped me to focus on what really matters on my solution
fred P.
Director
See Real Success Stories
Developers around the world trust Syncfusion’s Essential Studio to simplify complex projects and speed up delivery. With a vast library of UI controls, powerful SDKs, and reliable support, Essential Studio helps teams build enterprise-ready applications with confidence.
Read Our Customer StoriesIndustry
Software development
75% Cost reduction
50% Faster development
Industry
Utilities (oil and gas)
450+ hours saved
Streamlined processes and hours of development effort saved.
Advanced, flexible features
Empowered users through robust and versatile functionality.
Industry
Software and technology
1000+ of hours saved
Accelerated development with enterprise-ready UI components.
Efficient file management
Streamlined workflows with document libraries without building them from scratch.
Industry
Software and technology
2 Years of delay avoided
Two years of delays prevented with proactive planning.
On-time delivery
Projects delivered on schedule using trusted controls.
Industry
IT services and IT consulting
Improved performance
Large datasets handled with easy customization and quick debugging.
Highly customizable
Plug-and-play controls with quick template integration.
Industry
Professional services
Instant access
Quick availability of features and resources.
Reduced dependencies
Fewer dependencies for faster development.
Rated by users across the globe
Awards
Greatness—it’s one thing to say you have it, but it means more when others recognize it. Syncfusion® is proud to hold the following industry awards.

