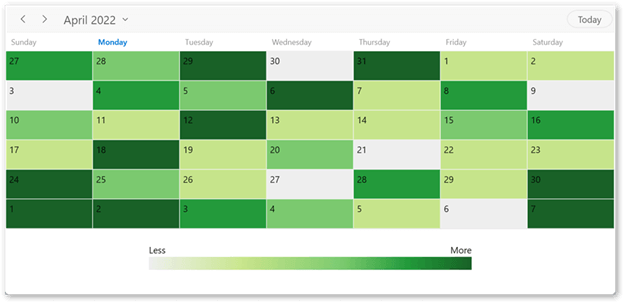
A heat map is a data visualization tool that uses different colors to display the variation in data.
Nowadays, internet data plays a significant role in our life. We use the internet to browse, download apps, check email, play games, pay bills, and more. This blog will show how to design a heat map calendar based on our daily internet data usage with the Syncfusion WinUI Scheduler control.
WinUI Scheduler
The Syncfusion WinUI Scheduler control is the only tool you need to design a heat map calendar. First, we have to customize the WinUI Scheduler’s month cell using the MonthCellTemplate or MonthCellTemplateSelector properties of the MonthViewSettings class. The DataContext of the MonthCellTemplate or MonthCellTemplateSelector properties is MonthCell.
Note: If you are new to the Scheduler, please read the WinUI Scheduler getting started documentation before proceeding.
Generating internet data usage details
First, generate the internet data usage details. You can use MonthCell data context class properties such as DateText and Appointments to bind the mobile data usage details in the MonthCellTemplate.
To generate the details of Appointments in the MonthCell, you need to create a custom event object to maintain the internet data, such as usage, date, and color. Map these custom event data properties to the Scheduler using the AppointmentMapping property to bind the mobile data usage details in the MonthCellTemplate.
Create an internet data model
Next, create a custom event with the required internet details. Refer to the following code example.
/// <summary>
/// Represents the Internet data properties.
/// </summary>
public class InternetData : NotificationObject
{
    private DateTime date;
    private Brush color;
    private int usage;

    public int Usage
    {
        get { return usage; }
        set
        {
            usage = value;
            RaisePropertyChanged("Usage");
        }
    }

    public DateTime Date
    {
        get { return date; }
        set
        {
            date = value;
            RaisePropertyChanged("Date");
        }
    }

    public Brush Color
    {
        get { return color; }
        set
        {
            color = value;
            RaisePropertyChanged("Color");
        }
    }
}
Create internet data collection
Then, create the collection of internet data objects and assign them to the ItemsSource property to generate the details of Appointments in the MonthCell. The MonthCell property is used to get the internet data usage in the MonthCellTemplate.
We are going to create a custom internet data collection of type ObservableCollection<InternetData> with the required internet data usage details.
public class HeatMapViewModel
{
  public HeatMapViewModel()
  {
     this.GenerateData();
  }

  public ObservableCollection<InternetData> InternetDataUsages { get; set; }

  /// <summary>
  /// Generate random data for heat map calendar based on internet data usage.
  /// </summary>
  private void GenerateData()
  {
     //// Creating an instance for internet data collection.
     InternetDataUsages = new ObservableCollection<InternetData>();
     var startDate = DateTime.Now.Date.AddMonths(-2);
     var random = new Random();

     //// Adding random data to the internet data collection.
     for (int i = 0; i < 200; i++)
     {
	InternetData internetData = new InternetData();
	internetData.Date = startDate.AddDays(i);
	//// Data usage in terms of GB.
	internetData.Usage = random.Next(0, 15);
	internetData.Color = GetColor(internetData.Usage);
	this.InternetDataUsages.Add(internetData);
     }
  }

  /// <summary>
  /// Methods to get the color based on data usage.
  /// </summary>
  /// <param name="data"></param>
  private Brush GetColor(int data)
  {
     //// Data usage in terms of GB.
     if (data < 3)
     {
	return new SolidColorBrush(Color.FromArgb(255, 238, 238, 238));
     }
     else if (data < 6)
     {
	return new SolidColorBrush(Color.FromArgb(255, 198, 228, 139));
     }
     else if (data < 9)
     {
	return new SolidColorBrush(Color.FromArgb(255, 123, 201, 111));
     }
     else if (data < 12)
     {
	return new SolidColorBrush(Color.FromArgb(255, 35, 154, 59));
     }
     else
     {
	return new SolidColorBrush(Color.FromArgb(255, 25, 97, 39));
     }
  }
}
Mapping the internet data object properties
Map the custom internet data object properties to the WinUI Scheduler control by configuring the AppointmentMapping property.
Refer to the following code example.
<Window
  ...
  xmlns:Scheduler="using:Syncfusion.UI.Xaml.Scheduler" >
  <Grid>
     <Grid.DataContext>
         <local:HeatMapViewModel />
     </Grid.DataContext>


     <Scheduler:SfScheduler x:Name="scheduler"
                              ItemsSource="{Binding InternetDataUsages }"
                              AppointmentEditFlag="None">
         <!--The collection of internet data object can be assigned to the scheduler ItemsSource property in order to generate the details of appointments in the MonthCell which is used to get the details of the internet data usage for the day-->

         <Scheduler:SfScheduler.AppointmentMapping>
            <Scheduler:AppointmentMapping StartTime="Date"
                                          AppointmentBackground="Color"/>
         </Scheduler:SfScheduler.AppointmentMapping>
     </Scheduler:SfScheduler>
  </Grid>
Designing a heat map calendar using WinUI Scheduler
Now, customize the month cell of the WinUI Scheduler control using the MonthCellTemplate property of the MonthViewSettings. Set the AppointmentEditFlag property to None in the Scheduler control to restrict the opening of the editor. Then, set the AppointmentDisplayMode property to None to avoid displaying appointments on the month cells.
Refer to the following code to design a heat map calendar using the MonthCellTemplate.
<Window
  ...
  xmlns:Scheduler="using:Syncfusion.UI.Xaml.Scheduler">

    <Grid>
        <Grid.DataContext>
            <local:HeatMapViewModel />
        </Grid.DataContext>
        <Grid.RowDefinitions>
            <RowDefinition Height="*"/>
            <RowDefinition Height="100"/>
        </Grid.RowDefinitions>
        <Scheduler:SfScheduler x:Name="scheduler"
                               ItemsSource="{Binding InternetDataUsages}"
                               AppointmentEditFlag="None">
            <!--The collection of internet data object can be assigned to the scheduler ItemsSource property in order to generate the details of appointments in the MonthCell which is used to get the details of the internet data usage for the day-->

            <Scheduler:SfScheduler.AppointmentMapping>
                <Scheduler:AppointmentMapping StartTime="Date"
                                              AppointmentBackground="Color"/>
            </Scheduler:SfScheduler.AppointmentMapping>
            <Scheduler:SfScheduler.MonthViewSettings>
                <Scheduler:MonthViewSettings AppointmentDisplayMode="None">
                    <!--Declare the DataTemplate for the scheduler month cell in order to create the heatmap calendar-->
                    <Scheduler:MonthViewSettings.MonthCellTemplate>
                        <DataTemplate>
                            <Grid Background="{Binding Appointments[0].Data.Color}">
                                <TextBlock HorizontalAlignment="Left" VerticalAlignment="Top" Margin="5" Text="{Binding DateText}" />
                            </Grid>
                        </DataTemplate>
                    </Scheduler:MonthViewSettings.MonthCellTemplate>
                </Scheduler:MonthViewSettings>
            </Scheduler:SfScheduler.MonthViewSettings>
        </Scheduler:SfScheduler>

         <Grid Grid.Row="1">
            <Grid.ColumnDefinitions>
                <ColumnDefinition Width="0.1*"/>
                <ColumnDefinition Width="0.8*"/>
                <ColumnDefinition Width="0.1*"/>
            </Grid.ColumnDefinitions>

            <Grid Grid.Column="1" HorizontalAlignment="Center">
                <Grid.RowDefinitions>
                    <RowDefinition Height="0.4*"/>
                    <RowDefinition Height="0.6*"/>
                </Grid.RowDefinitions>

                <TextBlock Text="Less" HorizontalTextAlignment="Start" VerticalAlignment="Bottom" Grid.Row="0">
                <TextBlock Text="More" HorizontalTextAlignment="End" VerticalAlignment="Bottom" Grid.Row="0"/>
                <Border Grid.Row="1" Margin="0,2,0,5" Height="20" MinWidth="500" VerticalAlignment="Top">
                    <Border.Background>
                        <LinearGradientBrush EndPoint="1,1">
                            <LinearGradientBrush.GradientStops>
                                <GradientStopCollection>
                                    <GradientStop Color="#eeeeee" Offset="0.0" />
                                    <GradientStop Color="#c6e48b" Offset="0.3" />
                                    <GradientStop Color="#7bc96f" Offset="0.6" />
                                    <GradientStop Color="#239a3b" Offset="0.8" />
                                    <GradientStop Color="#196127" Offset="1.0" />
                                </GradientStopCollection>
                            </LinearGradientBrush.GradientStops>
                        </LinearGradientBrush>
                    </Border.Background>
                </Border>
            </Grid>
        </Grid>
    </Grid>
</Window>
GitHub reference
Refer to the Designing a heat map calendar using the WinUI Scheduler GitHub demo to learn more.
Conclusion
Thanks for reading! This post gave a quick overview of designing a heat map calendar based on internet data usage using the Syncfusion WinUI Scheduler control. With one of these, you can easily understand the trends in data with different color patterns. Try out the steps in this blog post and share your feedback in the comments section!
For existing customers, the new version of Essential Studio® is available for download from the License and Downloads page. If you are not yet a Syncfusion customer, you can try our 30-day free trial to check out our available features.
For questions, you can contact us through our support forum, support portal, or feedback portal. We are always happy to assist you!
