
In this article, I’ll go over extracting data from JSON files and visualizing it with bar charts, line charts, and pie charts from the Syncfusion WPF Charts control. This can be achieved with the following easy steps:
- Process JSON data.
- Deserialize the JSON data to a dynamic object.
- Convert the list of dynamic objects to a data table.
- Create beautiful charts from the data table.
We will also cover how to export the charts to popular formats like PNG and JPEG.
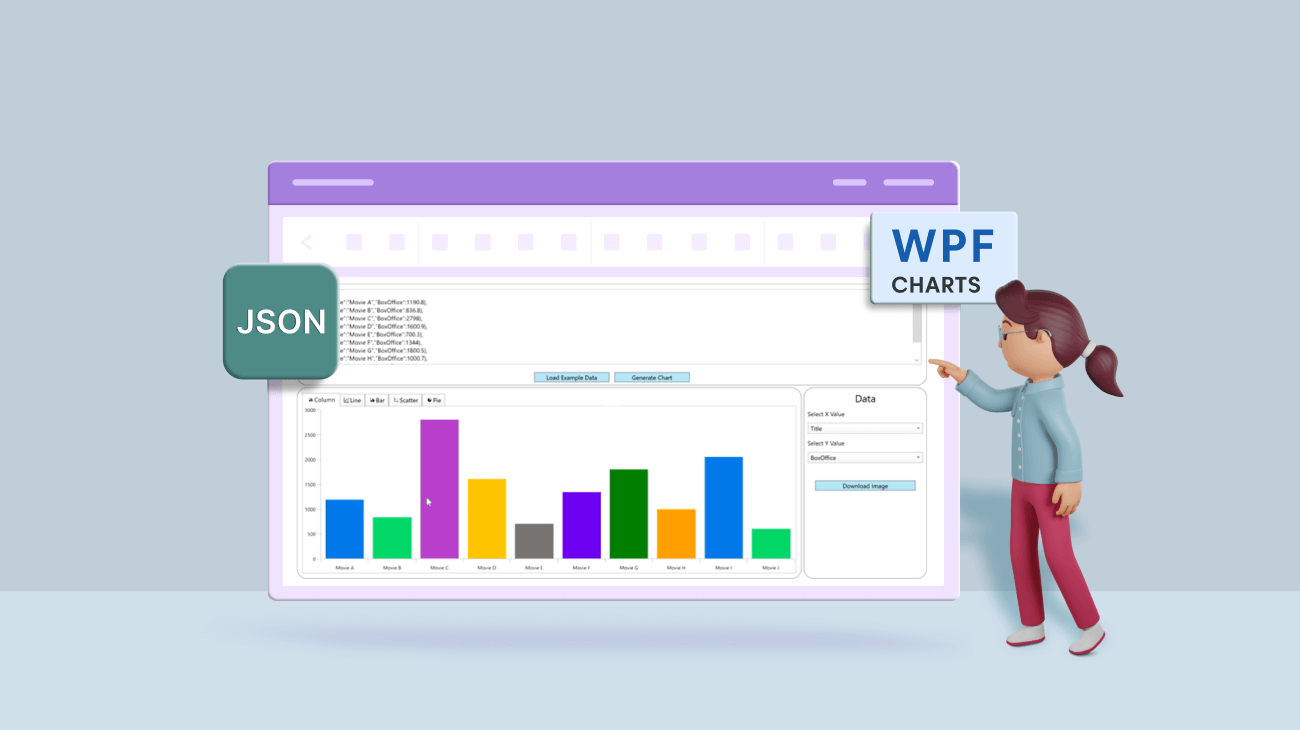
The final output of the demo app will look like the following.
Process JSON data
JSON is one of the most widely used data formats, but working with it can be challenging. In this section, we are going to see two ways data can be retrieved from a JSON string.
Follow these steps to populate a data collection from a JSON string:
Step 1: Install the Newtonsoft.Json NuGet package in your WPF project.
Step 2: Paste your JSON string into the text box or use a web service that provides order data to obtain the data, like the following example link.
https://ej2services.syncfusion.com/production/web-services/api/Orders
Step 3: In the ViewModel class, create required properties and methods for binding the data to the chart.
public class ViewModel : INotifyPropertyChanged
{
    public ViewModel()
    {
    }

    ObservableCollection<ExpandoObject> items = new ObservableCollection<ExpandoObject>();

    private string xBindingPath;
    public string XBindingPath
    {
       get
       {
           return xBindingPath;
       }
       set
       {
            xBindingPath = value;
            OnPropertyRaised(nameof(XBindingPath));

       }
   }

   private string yBindingPath;
   public string YBindingPath
   {
      get
      {
         return yBindingPath;
      }
      set
      {
         yBindingPath = value;
         OnPropertyRaised(nameof(YBindingPath));

      }
   }

   private DataTable data;
   public DataTable Data
   {
      get
      {
         return data;
      }
      set
      {
         data = value;
         OnPropertyRaised(nameof(Data));
      }
   }

   private List<string> xcolumns;

   public List<string> XColumns
   {
      get
      {
         return xcolumns;
      }
      set
      {
         xcolumns = value;
         OnPropertyRaised(nameof(XColumns));
      }
   }

   private List<string> ycolumns;

   public List<string> YColumns
   {
      get
      {
         return ycolumns;
      }
      set
      {
         ycolumns = value;
         OnPropertyRaised(nameof(YColumns));
      }
   }
}
Step 4: Retrieve the data from the JSON string and put it in the string property of the ViewModel.
private string jsonData;
public string JsonData
{
    get
    {
       return jsonData;
    }
    set
    {
       if(value != jsonData)
       {
          jsonData = value;
          GetDataAsync(jsonData);
          OnPropertyRaised(nameof(JsonData));
       }
    }
}
Deserialize the JSON data to dynamic object
Use JsonConvert class in Newtosoft.json to deserialize the JSON string. The DeserializeObject <ObservableCollection <ExpandoObject>> method call returns a simple object instance.
private bool IsValidJson(string strInput)
{
   if (string.IsNullOrWhiteSpace(strInput)) { return false; }
   strInput = strInput.Trim();
   if ((strInput.StartsWith("{") && strInput.EndsWith("}")) ||
       (strInput.StartsWith("[") && strInput.EndsWith("]")))
   {
       try
       {
          var obj = JToken.Parse(strInput);
          return true;
       }
       catch (JsonReaderException jex)
       {
          Console.WriteLine(jex.Message);
          return false;
       }
       catch (Exception ex)
       {
          Console.WriteLine(ex.ToString());
          return false;
       }
   }
   else
   {
       return false;
   }
}

private async void GetDataAsync(string json)
{
    Data = null;
    XBindingPath = string.Empty;
    YBindingPath = string.Empty;
    string jsonString = json;

    Uri uriResult;
    bool result = Uri.TryCreate(jsonString, UriKind.Absolute, out uriResult) &&
         (uriResult.Scheme == Uri.UriSchemeHttp || uriResult.Scheme == Uri.UriSchemeHttps);

    if (result)
    {
        using (HttpClient httpClient = new HttpClient()) {
           jsonString = await httpClient.GetStringAsync(jsonString);
        }
     }

     if (IsValidJson(jsonString))
     {
         items = JsonConvert.DeserializeObject<ObservableCollection<ExpandoObject>>(jsonString);
         Data = ToDataTable(items);
         GenerateXYColumns();
     }
     else
     {
         Data = null;
     }
}
Convert a dynamic object to a data table
Convert the processed JSON data into a data table. Refer to the following code.
DataTable ToDataTable(IEnumerable items)
{
    if (!items.Any()) return null;

    var table = new DataTable();
    bool isFirst = true;

    items.Cast<Idictionary<string, object>>().ToList().ForEach(x =>
    {
        if (isFirst)
        {
            foreach (var key in x.Keys)
            {
                table.Columns.Add(new DataColumn(key, x[key].GetType()));
            }

            isFirst = false;
        }
        table.Rows.Add(x.Values.ToArray());
    });

    return table;
}Spend less time building data visualization features from scratch. Syncfusion WPF Charts includes ready-to-use support for multiple chart types, data binding, interactive tooltips, legends, zooming, selection, and responsive layouts.
Start Building TodayCreate beautiful charts
With the JSON data converted into a data table, it is ready to be mapped into the WPF Charts control. You can now easily plot the values of the data table on different types of charts.
The following code snippet demonstrates how to create a bar chart from the data table.
<chart:SfChart >
 <chart:SfChart.PrimaryAxis>
  <chart:CategoryAxis LabelPlacement=”BetweenTicks”
                      ShowGridLines=”False” />
 </chart:SfChart.PrimaryAxis>

 <chart:SfChart.SecondaryAxis>
  <chart:NumericalAxis/>
 </chart:SfChart.SecondaryAxis>

 <chart:FastColumnBitmapSeries ItemsSource=”{Binding Data}”
                               XbindingPath=”{Binding XbindingPath}”
                               YbindingPath=”{Binding YbindingPath}” />
</chart:SfChart>
Exporting charts
You can also export charts to popular image formats like PNG and JPEG. Refer to the following code.
if (chart != null)
{
    SaveFileDialog sfd = new SaveFileDialog();
    sfd.FileName = “Untitled”;
    sfd.Filter = “JPEG(*.jpg,*.jpeg)|*.jpg;*.jpeg|Gif (*.gif)|*.gif|PNG(*.png)|*.png|Bitmap(*.bmp)|*.bmp|All files (*.*)|*.*”;
    if (sfd.ShowDialog() == true)
    {
        using (Stream fs = sfd.OpenFile())
        {
            chart.Save(fs, new JpegBitmapEncoder());
        }
    }
}
Resource
For more information, refer to the project Visualize JSON Data in WPF Charts on GitHub.
Conclusion
Thanks for reading! In this blog, we have seen how to use the Syncfusion Charts control to visualize JSON data in a WPF application. Try out the steps provided in this blog post and create beautiful charts.
To find detailed explanations of each feature in the Charts control with code examples, refer to this documentation.
Please feel free to share your feedback or ask questions in the comments section below. You can also contact us through our support forum, support portal, or feedback portal. We are happy to assist you!


 No spam, just valuable updates.