A pivot table puts together raw data from various data sources that are normally flat, resulting in many individual and detailed records that are unorganized. When raw data lacks structure, it isn’t easy to understand for any user.
This is where the Syncfusion JavaScript Pivot Table’s data aggregation feature comes in. This feature converts raw data into summarized and organized data using a pivot engine. The data is then bound to a pivot table UI for viewing the well-structured and understandable result.
Let’s explore this powerful and user-friendly feature with code examples.
Aggregation types
The most popular aggregation types supported by the JavaScript Pivot Table are:
- Sum
- Product
- Count
- Distinct Count
- Min
- Max
- Average
Other types of aggregations are:
- Median
- Index
- PopulationStDev
- SampleStDev
- PopulationVar
- SampleVar
- RunningTotals
- DifferenceFrom
- PercentageOfDifferenceFrom
- PercentageOfGrandTotal
- PercentageOfColumnTotal
- PercentageOfRowTotal
- PercentageOfParentTotal
- PercentageOfParentColumnTotal
- PercentageOfParentRowTotal
Use case
Let’s look at a real-time scenario in a supermarket. Many sales occur there throughout the day. Every sale will be treated as a separate record added to the database, which is our raw data. It would be difficult to analyze product sales using raw data alone, and this raw data must be converted to a structured, organized format.
For instance, take the product Polo T-Shirt. If an analyst wants to know the minimum or maximum number of polo t-shirt purchases per month, quarter, or year, they can use the Min and Max aggregates. If the analyst wants to know the average sales of t-shirts per month, quarter, or year, they can use the Avg aggregate.
Points to remember
Before diving deep into data aggregation in our JavaScript Pivot Table, remember the following points:
- Despite the fact that the Pivot Table supports many aggregation types, fields with data types such as numbers support all the listed aggregation types. Meanwhile, the fields with data types such as string, date, datetime, and Boolean support only count and distinct count aggregation types.
- By default, the aggregation type will be Sum for number-type fields and Count for non-number-type fields.
- The aggregation types are available only for fields in the Values section.
Getting started with data aggregation in JavaScript Pivot Table
The aggregation type can be set to a field in the Pivot Table via:
- UI option: Changes the aggregation type dynamically at runtime.
- Code-behind: Displays the aggregated field in the pivot table during initial loading.
Perform data aggregation via UI
To do the data aggregation via UI, use the dropdown arranged inside the Values section.
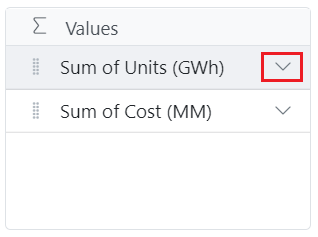
A list of basic aggregation types will appear, which can be selected from and changed at runtime.
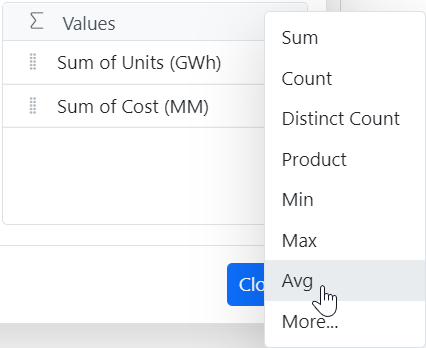
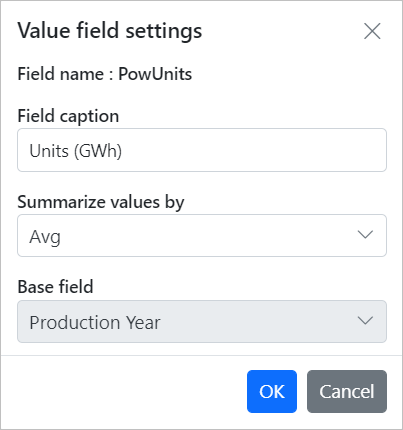
Click the More option at the bottom of the context menu. It opens a dialogue with advanced aggregation settings to handle a field based on your requirements.
So, these are the primary steps for dynamically changing an aggregation type for any field at runtime via UI.
Perform data aggregation via code-behind
To do the data aggregation via code-behind, in the Values section, first define the field with its name and caption.
The type property then accepts the assigned aggregate type and processes it in the pivot engine before providing the result data to render the pivot table UI.
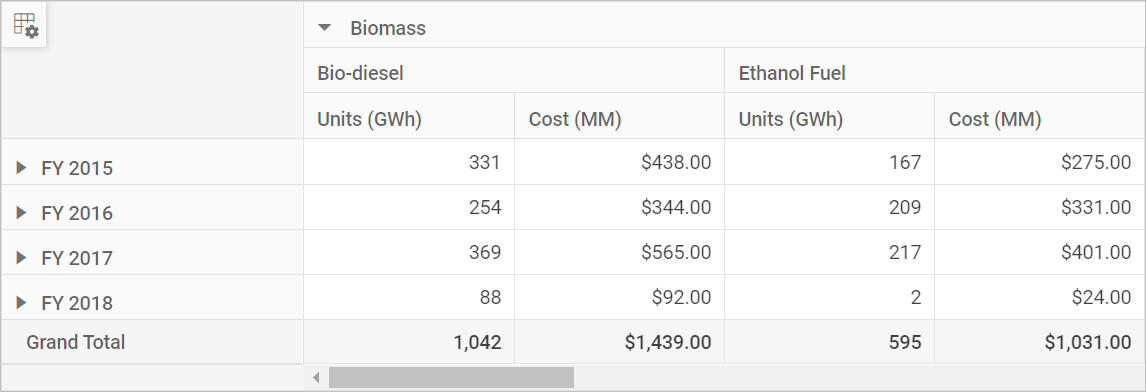
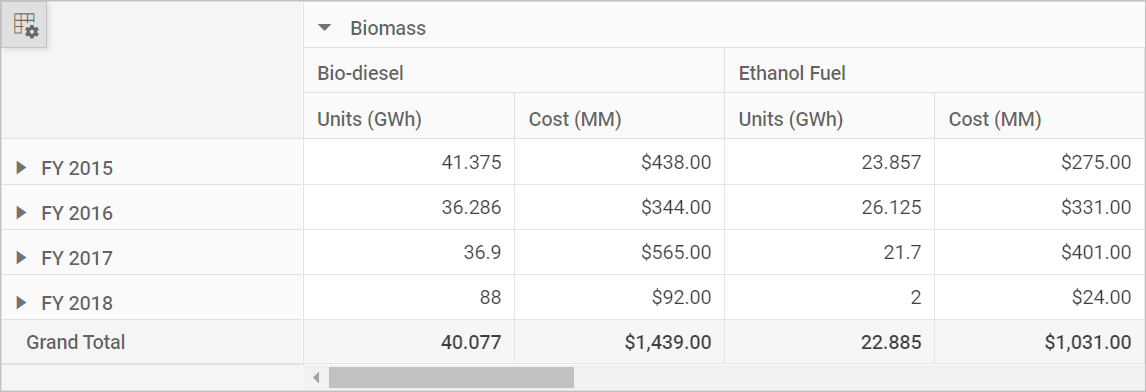
Refer to the following code example. In it, we have used the aggregation type Avg.
import { PivotView, IDataSet } from '@syncfusion/ej2-pivotview';
import { pivotData } from './datasource.ts';

let pivotTableObj: PivotView = new PivotView({
    dataSourceSettings: {
        dataSource: pivotData as IDataSet[],
        columns: [{ name: 'EnerType', caption: 'Energy Type' }, { name: 'EneSource', caption: 'Energy Source' }],
        values: [{ name: 'PowUnits', caption: 'Units (GWh)', type: 'Avg' }, { name: 'ProCost', caption: 'Cost (MM)' }],
        rows: [{ name: 'Year', caption: 'Production Year' }, { name: 'Quarter', caption: ' Quarter Year' }],
        filters: []
    }
});
pivotTableObj.appendTo('#PivotTable');
Refer to the following images.
Customization options
The JavaScript Pivot Table’s data aggregation feature comes with more options:
- The ability to show or hide the UI icon allows us to dynamically change the aggregation type at runtime. By default, the UI icon will be displayed.
- Rather than displaying all aggregation types in the context menu, one can display only the desired types.
- The ability to edit the aggregation text in the UI. For example, “Sum of Units Sold” can be displayed as “Units Sold” as well.
References
For more details, refer to the Aggregation in JavaScript Pivot Table demos and documentation.
Conclusion
Thanks for reading! This blog explored the data aggregation feature in the Syncfusion JavaScript Pivot Table. With this feature, we can convert raw data into summarized and organized data to get clear insights from it.
We strongly urge you to explore our Syncfusion Essential JS 2 suite, which boasts over 80 user-friendly JavaScript UI controls. Your feedback is essential to us, and we encourage you to share your thoughts in the comments section below.
Existing customers can access the newest version of Essential Studio from the License and Downloads page. If you’re not a customer yet, we offer a 30-day free trial to let you experience the full range of available features.
If you have questions, you can contact us through our support forum, support portal, or feedback portal. Our team is always eager to help you.