
Welcome to the Chart of the Week blog series!
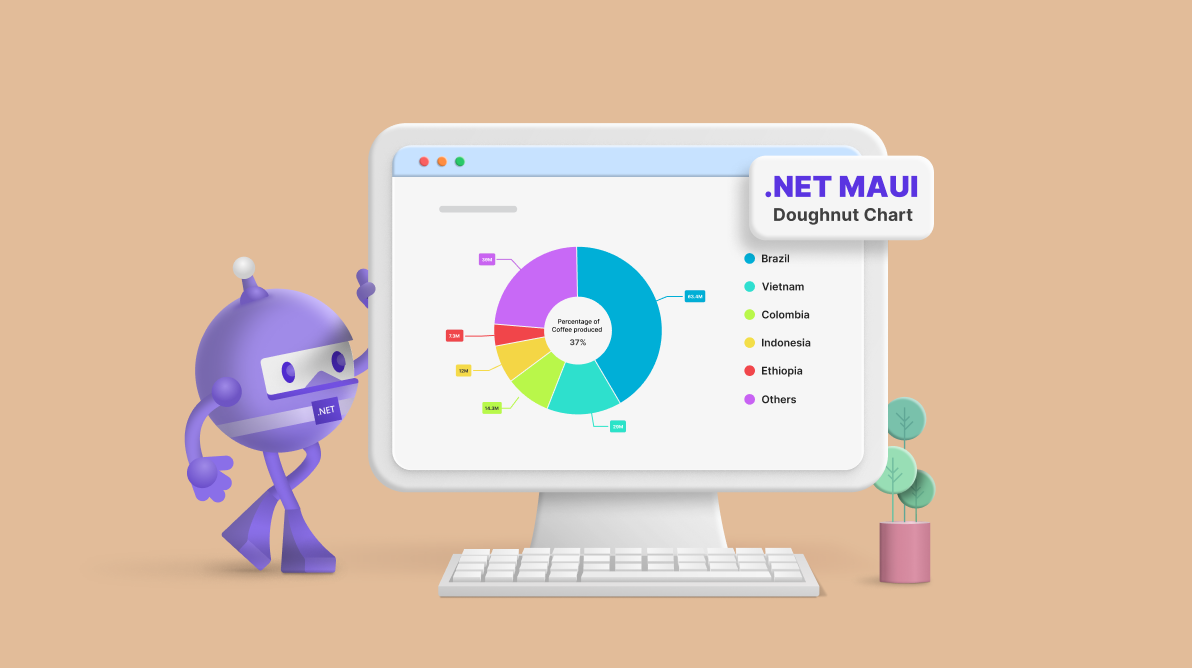
Today, we will visualize the top coffee-producing countries worldwide with the help of the Syncfusion .NET MAUI doughnut chart. This control is supported on both desktop (Windows and MacCatalyst) and mobile platforms (Android and iOS).
The world coffee production in 2023 was 4.3 million bags, higher than the previous year to 174.34 million bags. During the fruit development stage in January 2023, the major coffee-growing region of Minas Gerais encountered abnormally high levels of rainfall.
Refer to the following image, which explains the top coffee-producing countries and their production in 2023.
In this blog, we’ll replicate this chart using the Syncfusion .NET MAUI doughnut chart control.
Step 1: Gather coffee production data
Before creating a chart, we need to gather data on coffee production from the International Coffee Organization. For this demonstration, we obtain data on the countries involved, production amounts in millions, and market share percentages. You can save the data in CSV format.
Step 2: Prepare the data for the doughnut chart
Define the CoffeeProductionModel class with the properties Country, Production, MarketShare, and Index to hold the coffee production details.
Refer to the following code example.
public class CoffeeProductionModel
{
    public string Country { get; set; }
    public double Production { get; set; }
    public double MarketShare { get; set; }
    public double Index { get; set; }

    public CoffeeProductionModel(double index, string country, double production, double marketShare)
    {
        Index = index;
        Country = country;
        Production = production;
        MarketShare = marketShare;
    }
}
Next, generate the production details using the WorldCoffeeProduction class and ProductionDetails property. Convert the CSV data to a collection of countries and production amounts using the ReadCSV method and store it in the ProductionDetails property.
Additionally, the selection properties need an interactive feature. In the interactive feature section, we will cover more about this.
Refer to the following code example.
public class WorldCoffeeProduction : INotifyPropertyChanged
{

    List<CoffeeProductionModel> productionDetails;
    public List<Brush> PaletteBrushes { get; set; }
    public List<Brush> SelectionBrushes { get; set; }

    public List<CoffeeProductionModel> ProductionDetails
    {
       get
       {
          return productionDetails;
       }
       set
       {
          productionDetails = value;
          NotifyPropertyChanged(nameof(ProductionDetails));
       }
    }


    private Brush selectionBrush;
    public Brush SelectionBrush
    {
        get
        {
           return selectionBrush;
        }
        set
        {
           selectionBrush = value;

           NotifyPropertyChanged(nameof(SelectionBrush));
        }
    }

    private string country;
    public string Country
    {
       get
       {
          return country;
       }
       set
       {
                country = value;
                NotifyPropertyChanged(nameof(Country));
       }
    }

    private double Production;
    public double Production
    {
       get
       {
          return production;
       }
       set
       {
          production = value;
          NotifyPropertyChanged(nameof(Production));
       }
     }

     private double Percentage;
     public double Percentage
     {
        get
        {
           return percentage;
        }
        set
        {
           percentage = value;
           NotifyPropertyChanged(nameof(Percentage));
        }

      }

      private int selectedIndex = 0;
      public int SelectedIndex
      {
         get
         {
            return selectedIndex;
         }
         set
         {
            selectedIndex = value;
            SelectionBrush = SelectionBrushes[SelectedIndex];
            UpdateIndex(value);
            NotifyPropertyChanged(nameof(SelectedIndex));
          }
       }

       private double groupTo = 7;
       public double GroupTo
       {
           get { return groupTo; }
           set { groupTo = value; }
       }

       public WorldCoffeeProduction()
       {
          ProductionDetails = new List<CoffeeProductionModel>(ReadCSV());

          PaletteBrushes = new List<Brush>
          {
              new SolidColorBrush(Color.FromArgb("#5bdffc")),
              new SolidColorBrush(Color.FromArgb("#2fe0d0")),
              new SolidColorBrush(Color.FromArgb("#baf74d")),
              new SolidColorBrush(Color.FromArgb("#f5d949")),
              new SolidColorBrush(Color.FromArgb("#f2464d")),
              new SolidColorBrush(Color.FromArgb("#c86af7"))
           };

           SelectionBrushes = new List<Brush>
           {
              new SolidColorBrush(Color.FromArgb("#00b1d9")),
              new SolidColorBrush(Color.FromArgb("#05b3a2")),
              new SolidColorBrush(Color.FromArgb("#8ccf15")),
              new SolidColorBrush(Color.FromArgb("#d9b709")),
              new SolidColorBrush(Color.FromArgb("#d40b13")),
              new SolidColorBrush(Color.FromArgb("#9e07e3"))
           };
        }

        public IEnumerable<CoffeeProductionModel> ReadCSV()
        {
            Assembly executingAssembly = typeof(App).GetTypeInfo().Assembly;
            Stream inputStream = executingAssembly.GetManifestResourceStream("CoffeeProductionChart.Resources.Raw.coffeproductionbycountry.csv");

            string? line;
            List<string> lines = new List<string>();

            using StreamReader reader = new StreamReader(inputStream);
            while ((line = reader.ReadLine()) != null)
            {
                lines.Add(line);
            }

            return lines.Select(line =>
            {
                string[] data = line.Split(',');
                return new CoffeeProductionModel(Convert.ToDouble(data[0]), data[1], Convert.ToDouble(data[2]), Convert.ToDouble(data[3]));
            });
        }

        private void UpdateIndex(int value)
        {
            if (value >= 0 && value < ProductionDetails.Count)
            {
                var model = ProductionDetails[value];
                if (model != null && model.Country != null)
                {
                    if (model.Production < GroupTo)
                    {
                        Production = 0;
                        Percentage = 0;
                        Country = "";
                        foreach (var item in productionDetails)
                        {
                            if (GroupTo > item.Production)
                            {
                                Country = "Others";
                                Production += item.Production;
                                Percentage += item.MarketShare;
                            }
                        }
                    }
                    else
                    {
                        Country = model.Country;
                        Production = model.Production;
                        Percentage = model.MarketShare;
                    }
                }
            }
        }

        public event PropertyChangedEventHandler PropertyChanged;

        public void NotifyPropertyChanged([CallerMemberName] String propertyName = "")
        {
            PropertyChanged?.Invoke(this, new PropertyChangedEventArgs(propertyName));
        }
}
Step 3: Configure the Syncfusion .NET MAUI Circular Charts
Let’s configure the Syncfusion .NET MAUI Circular Charts control.
Refer to the following code example.
<chart:SfCircularChart >
</chart:SfCircularChart>
Step 4: Binding coffee production data
To bind the coffee production data, we’ll use the Syncfusion DoughnutSeries class.
<chart:DoughnutSeries  x:Name="series" ItemsSource="{Binding ProductionDetails}" XBindingPath="Country" YBindingPath="Production">
</chart:DoughnutSeries>
In this example, we’ve bound the ProductionDetails with the ItemSource property. The XBindingPath and YBindingPath are bound with the Country and Production properties, respectively.
Step 5: Customizing the chart appearance
We can customize the doughnut chart’s appearance by customizing the doughnut segment colors, showing data labels, adding a title to the chart, and more.
Refer to the following code example to customize the doughnut chart title using the Title property in the SfCircularChart.
<chart:SfCircularChart.Title>
 <Border Background="#443c8f" StrokeThickness="1" Margin="0">
  <VerticalStackLayout>
   <Grid Padding="4">
    <Grid.ColumnDefinitions>
     <ColumnDefinition Width="34"/>
     <ColumnDefinition Width="*"/>
    </Grid.ColumnDefinitions>
    <StackLayout Margin="0,0,0,0" VerticalOptions="Start" Orientation="Vertical">
     <Path Fill="White" HorizontalOptions="CenterAndExpand" VerticalOptions="Center" TranslationX="0.5" ScaleY="1.1" TranslationY="0.5" Data="{Binding PathData}"></Path>
    </StackLayout>
    <StackLayout Grid.Column="1" Margin="5,0,0,0"  VerticalOptions="Center" HorizontalOptions="Start" Orientation="Vertical">
     <Label  Text="The World's Top Coffee-Producing Countries" FontSize="22"  FontAttributes="Bold" TextColor="white"/>
    </StackLayout>
   </Grid>
  </VerticalStackLayout>
 </Border>
</chart:SfCircularChart.Title>
Let’s configure the chart legend using the ItemTemplate property and position the legend items using the Placement property.
<chart:SfCircularChart.Legend>
 <chart:ChartLegend x:Name="chartLegend" Placement="Right" >
  <chart:ChartLegend.ItemTemplate>
   <DataTemplate>
    <StackLayout WidthRequest="{OnPlatform WinUI='150', Android='90',iOS='90',MacCatalyst='140'}" Margin="0,0,80,0" Orientation="Horizontal">
     <Ellipse WidthRequest="15" HeightRequest="15" Fill="{Binding IconBrush}" HorizontalOptions="Center" VerticalOptions="Center" />
     <Label FontSize="{OnPlatform WinUI='15', Android='13',MacCatalyst='15',iOS='13'}" Margin="5,0,0,0" FontAttributes="Bold" Text="{Binding Item,Converter={StaticResource legend}}" VerticalTextAlignment="Start"  HorizontalTextAlignment="Start" />
    </StackLayout>
   </DataTemplate>
  </chart:ChartLegend.ItemTemplate>
 </chart:ChartLegend>
</chart:SfCircularChart.Legend>
Then, we customize the doughnut segment color, border, and width and group the data points less than the specific value using the PaletteBrushes, Stroke, StrokeWidth, and GroupTo properties, respectively.
We can also modify the start and end positions of a segment in the chart using the StartAngle and EndAngle properties.
<chart:DoughnutSeries ShowDataLabels="True" x:Name="series" StartAngle="270" EndAngle="630"
           PaletteBrushes="{Binding PaletteBrushes}"
           ItemsSource="{Binding ProductionDetails}" GroupTo="{Binding GroupTo}"
           XBindingPath="Country" Stroke="white" StrokeWidth="1"
           YBindingPath="Production">
</chart:DoughnutSeries>
Configure the CenterView property to add information about coffee production. You can define the size of the center view using the InnerRadius property of the doughnut series. The CenterHoleSize property is used to prevent overlapping among the doughnut chart segments and center.
<chart:DoughnutSeries.CenterView>
 <StackLayout x:Name="layout" HeightRequest="{Binding CenterHoleSize}" HorizontalOptions="Center" VerticalOptions="CenterAndExpand" WidthRequest="{Binding CenterHoleSize}">
  <Label Text="Percent of" FontSize="{OnPlatform WinUI='13',Android='9',iOS='10',MacCatalyst='13'}" VerticalTextAlignment="Center" HorizontalOptions="Center" VerticalOptions="EndAndExpand" Margin="{OnPlatform WinUI='0',Android='5',MacCatalyst='10',iOS='5'}"/>
  <Label Text="Coffee Produced" FontSize="{OnPlatform WinUI='13',Android='9',iOS='10',MacCatalyst='13'}" VerticalOptions="StartAndExpand" Margin="0"  HorizontalOptions="Center" />
  <Label  Text="{Binding Percentage,Source={x:Reference coffeeProduction},StringFormat='{0:P0}'}" FontAttributes="Bold" FontSize="{OnPlatform WinUI='15',Android='9',iOS='12',MacCatalyst='14'}" HorizontalOptions="Center" VerticalOptions="StartAndExpand" Margin="{OnPlatform Android='0',iOS='0',Default='0,-20,0,0'}"/>
 </StackLayout>
</chart:DoughnutSeries.CenterView>
We can customize the data labels in the chart using the DataLabelSettings property. Use the LabelPlacement property to place the data labels at the desired position. Modify the label style with an appropriate format using LabelFormat property.
We should enable the ShowDataLabels property in the doughnut series to display the data labels.
<chart:DoughnutSeries.DataLabelSettings>
 <chart:CircularDataLabelSettings UseSeriesPalette="True" LabelPlacement="Outer">
  <chart:CircularDataLabelSettings.LabelStyle>
   <chart:ChartDataLabelStyle LabelFormat="###.#M" />
  </chart:CircularDataLabelSettings.LabelStyle>
 </chart:CircularDataLabelSettings>
</chart:DoughnutSeries.DataLabelSettings>
Step 6: Add interactivity feature
We can add interactive features to view the data for the selected segment in our chart using the SelectionBehavior property.
The selection features can highlight a specific data point, raise an event, or modify the value of the SelectedIndex property based on the segment selection. The SelectionBrush property is used to highlight the selected segment in the chart.
Here, we’ll bind the SelectedIndex to the series center view to show additional information about the data. Refer to the following code example.
<chart:DoughnutSeries.SelectionBehavior>
 <chart:DataPointSelectionBehavior SelectionBrush="{Binding SelectionBrush}" SelectedIndex="{Binding SelectedIndex,Mode=TwoWay}"  />
</chart:DoughnutSeries.SelectionBehavior>
After executing the previous code example, we’ll get output like in the following image.

GitHub reference
For more details, refer to the GitHub demo.
Conclusion
Thanks for reading! In this blog, we’ve seen how to visualize the world’s top coffee-producing countries using the Syncfusion .NET MAUI doughnut chart. Like this, you can also visualize other trends and changes worldwide. We encourage you to try the steps discussed and share your thoughts in the comments section below.
You can also reach us via our support forum, support portal, or feedback portal. We are always eager to help you!


 No spam, just valuable updates.