Syncfusion Showcases at Microsoft Build 2024 Graham High May 15, 2024 UPDATEDPopular Now Enhancing Your Application with GraphQL-Based CRUD Operations in React Grid Maithiliy K May 16, 2024 Advanced Query Building Techniques in Angular: Queries with Different Connectors Satheeskumar S May 16, 2024 Chart of the week: Creating a line chart with plot bands to explore global GNI per capita with income thresholds Sowndharya Selladurai May 15, 2024 Load Appointments on Demand in Blazor Scheduler using Entity Framework Core Venkateshwaran Saravanakumar May 15, 2024 Optimizing Productivity: Integrate Salesforce with JavaScript Scheduler Mugilraj Govindarajan May 15, 2024 UPDATED What is Cybersecurity? Katherine Dobson May 14, 2024 Reached 50! A Milestone for the Chart of the Week Blog Series Vimala Thirumalai Kumar May 13, 2024 PNPM vs. NPM vs. Yarn: What Should I Choose in 2024? Nipuni Arunodi May 16, 2024 UPDATED Performance Optimization in React Pivot Table with Data Compression Manikandan Murugesan May 9, 2024 Navigate PDF Annotations in a TreeView Using WPF PDF Viewer Vikas S May 9, 2024 Chart of the Week: Creating a .NET MAUI Line Chart to Analyze Wage Trends in the Texas Oil Gas Extraction Industry Nanthini Mahalingam May 14, 2024 UPDATED Visualize Customer Survey Reports Using React 3D Circular Charts [Webinar Show Notes] Carter Harris May 7, 2024 1 2 3 4 5 6 … 182 Be the first to get updates Subscribe Subscribe RSS feed
Advanced Query Building Techniques in Angular: Queries with Different Connectors Satheeskumar S May 16, 2024
Chart of the week: Creating a line chart with plot bands to explore global GNI per capita with income thresholds Sowndharya Selladurai May 15, 2024
Load Appointments on Demand in Blazor Scheduler using Entity Framework Core Venkateshwaran Saravanakumar May 15, 2024
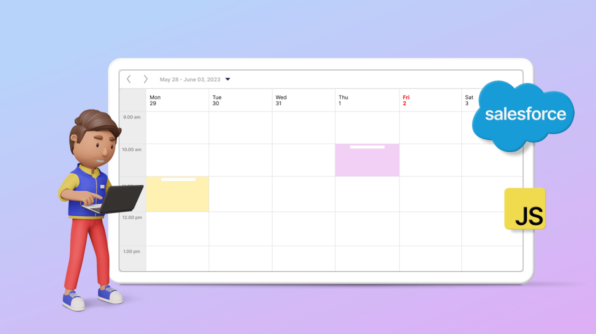
Optimizing Productivity: Integrate Salesforce with JavaScript Scheduler Mugilraj Govindarajan May 15, 2024 UPDATED
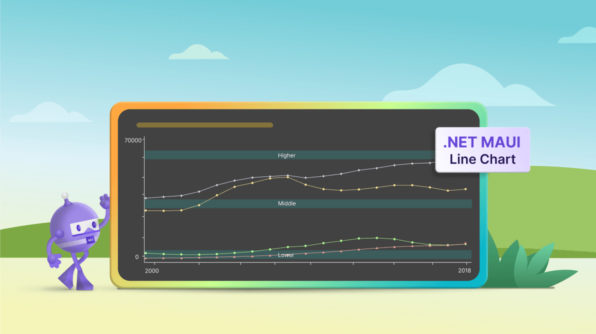
Chart of the Week: Creating a .NET MAUI Line Chart to Analyze Wage Trends in the Texas Oil Gas Extraction Industry Nanthini Mahalingam May 14, 2024 UPDATED
Visualize Customer Survey Reports Using React 3D Circular Charts [Webinar Show Notes] Carter Harris May 7, 2024


![Visualize Customer Survey Reports Using React 3D Circular Charts [Webinar Show Notes]](https://www.syncfusion.com/blogs/wp-content/uploads/2024/05/Visualize-Customer-Survey-Reports-Using-React-3D-Circular-Charts-Webinar-Show-Notes-thegem-blog-justified.png)