

In our 2019 Volume 3 release, we rolled out seven new chart types for the Syncfusion Flutter Charts widget. We are continuously receiving constructive feedback from our customers and subsequently received requests for many other chart types.
We processed these requests and handpicked seven chart types to make available with our 2019 Volume 4 release. In this blog, we will quickly view the new chart types implemented, along with some new features.
New chart types
As stated in the introduction, we have extended the Syncfusion Flutter Charts widget to support seven more chart types:
- 100% stacked column chart
- 100% stacked bar chart
- 100% stacked line chart
- 100% stacked area chart
- Range area chart
- Step area chart
- Spline area chart
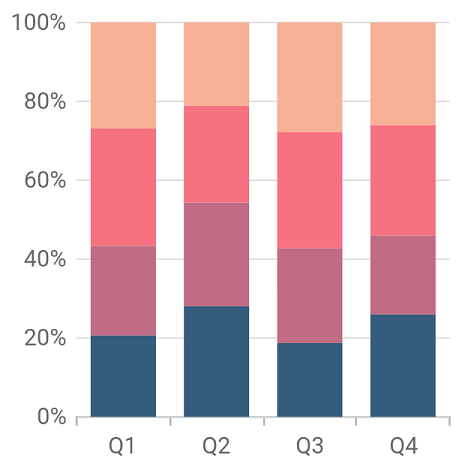
100% stacked column chart
The 100% stacked column chart shows the relative percentages of multiple data series in stacked columns. The cumulative proportion of each stacked column always totals 100%. The following code illustrates how to render the 100% stacked column chart.
SfCartesianChart(
  series: <ChartSeries<_ChartData, String>>[
    StackedColumn100Series<_ChartData, String>(
      dataSource: chartData,
      xValueMapper: (_ChartData sales, _) => sales.x,
      yValueMapper: (_ChartData sales, _) => sales.y1,
      name: 'Product A'
    ),
    // Add more series
  ]
)
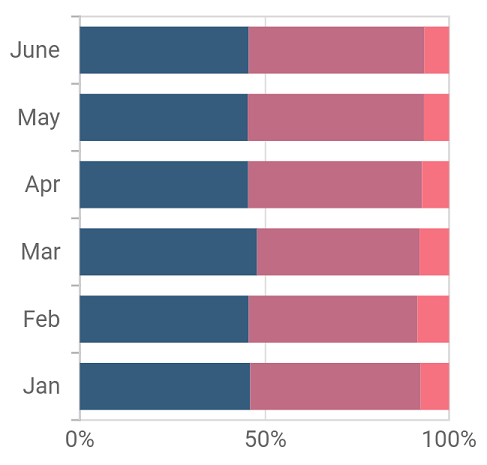
100% stacked bar chart
The 100% stacked bar chart is similar to the 100% stacked column chart, the only difference being that it renders the bars horizontally. The following code illustrates how to render the 100% stacked bar chart.
SfCartesianChart(
  series: <ChartSeries<_ChartData, String>>[
    StackedBar100Series<_ChartData, String>(
      dataSource: chartData,
      xValueMapper: (_ChartData sales, _) => sales.x,
      yValueMapper: (_ChartData sales, _) => sales.y1,
      name: 'Apple'
    ),
    // Add more series
  ]
)
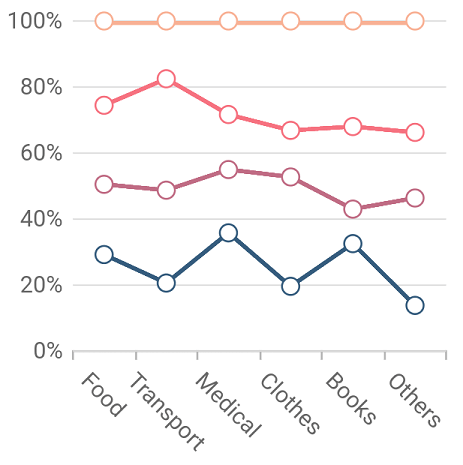
100% stacked line chart
The 100% stacked line chart shows the relative percentages of multiple data series in stacked lines and the cumulative proportion of each stacked line, which always totals 100%. The following code illustrates how to render the 100% stacked line chart.
SfCartesianChart(
  series: <ChartSeries<_ChartData, String>>[
    StackedLine100Series<_ChartData, String>(
      dataSource: chartData,
      xValueMapper: (_ChartData sales, _) => sales.x,
      yValueMapper: (_ChartData sales, _) => sales.y1,
      name: 'Product A'
    ),
    // Add more series
  ]
)
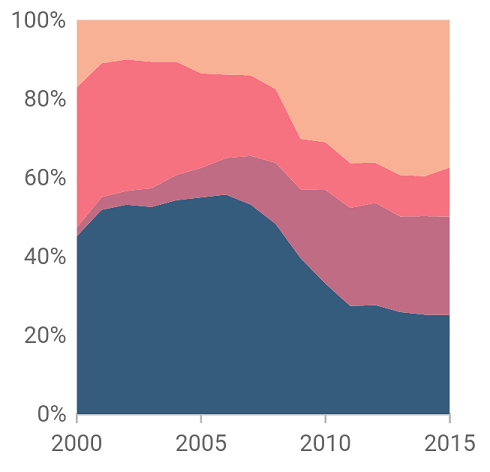
100% stacked area chart
Similar to the 100% stacked line chart, the 100% stacked area chart also displays the relative percentages of multiple data series, but as stacked areas. The following code illustrates how to render the 100% stacked area chart.
SfCartesianChart(
  series: <ChartSeries<_ChartData, String>>[
    StackedArea100Series<_ChartData, String>(
      dataSource: chartData,
      xValueMapper: (_ChartData sales, _) => sales.x,
      yValueMapper: (_ChartData sales, _) => sales.y1,
      name: 'Product A'
    ),
    // Add more series
  ]
)
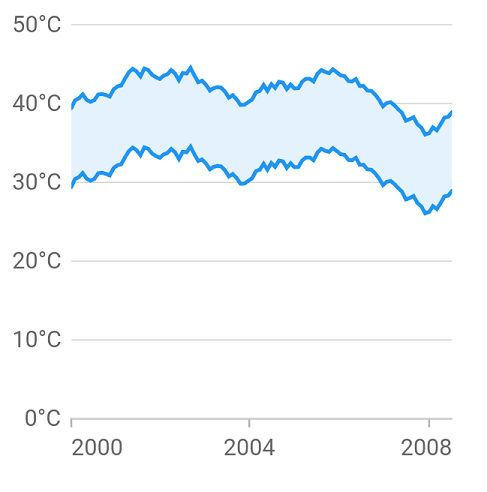
Range area chart
The range area chart is like an area chart, but the area will start from the specified low value, instead of 0. The following code illustrates how to render the range area chart.
SfCartesianChart(
  series: <ChartSeries<_ChartData, String>>[
    RangeAreaSeries<_ChartData, String>(
      dataSource: chartData,
      xValueMapper: (_ChartData sales, _) => sales.x,
      highValueMapper: (_ChartData sales, _) => sales.high,
      lowValueMapper: (_ChartData sales, _) => sales.low,
      name: 'Product A'
    ),
    // Add more series
  ]
)
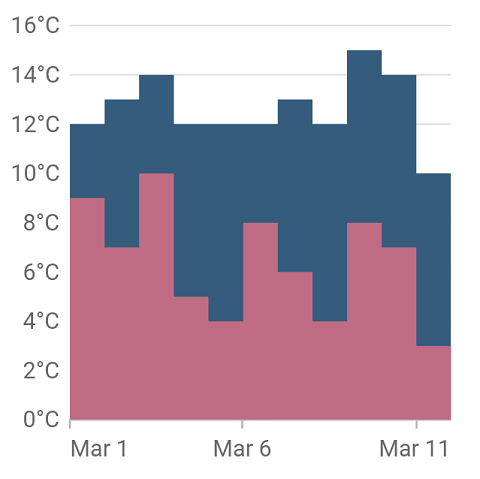
Step area chart
The step area chart is the combination of a step line chart and an area chart, where the area is connected with step lines. The following code illustrates how to render the step area chart.
SfCartesianChart(
  series: <ChartSeries<_ChartData, String>>[
    StepAreaSeries<_ChartData, String>(
      dataSource: chartData,
      xValueMapper: (_ChartData sales, _) => sales.x,
      yValueMapper: (_ChartData sales, _) => sales.y1,
      name: 'Product A'
    ),
    // Add more series
  ]
)
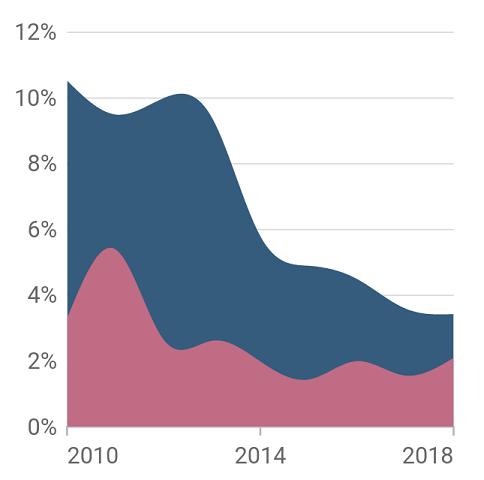
Spline area chart
The spline area chart is the combination of a spline chart and an area chart, where the area is connected with smooth, curved lines. The following code illustrates how to render the spline area chart.
SfCartesianChart(
  series: <ChartSeries<_ChartData, String>>[
    SplineAreaSeries<_ChartData, String>(
      dataSource: chartData,
      xValueMapper: (_ChartData sales, _) => sales.x,
      yValueMapper: (_ChartData sales, _) => sales.y1,
      name: 'Product A'
    ),
    // Add more series
  ]
)
New features
Display tooltip at the pointer location
In chart types like column, bar, pie, doughnut, pyramid, and funnel, the tooltip will be displayed at a specific, constant position. But now Syncfusion Flutter Charts has the support to display the tooltip at the pointer location itself.
SfCartesianChart(
  tooltipBehavior: TooltipBehavior(
     enable: true, tooltipPosition: TooltipPosition.pointer
  )
)
Disappear delay for crosshair and trackball
Usually the crosshair and trackball will be hidden immediately when the touch contact is removed from the chart. But now they can be hidden after a certain time delay.
SfCartesianChart(
   crosshairBehavior: CrosshairBehavior(
      enable: true,
      hideDelay: 3000
   )
)
Custom empty points average calculation
The empty data points value in a series can be considered as zero, the average of all other data points in the series, or as a gap. By using this feature, you can write your own custom implementation logic to calculate the empty points average.
Conclusion
I hope you are excited to use these new features in your Flutter applications. For existing customers, the new version is available for download from the license and downloads page or you can get the packages directly from pub.dev. If you are not yet a customer, you can try our 30-day free trial to check out these new features. Try our samples from the GitHub location, Play store, or App Store.
Also, if you wish to send us feedback or would like to submit any questions, please feel free to post them in the comments section of this blog post. You can also contact us through our support forum, feedback portal, or Direct-Trac support system.


 No spam, just valuable updates.