
TL;DR: Explore global renewable energy employment trends with Syncfusion’s .NET MAUI Bar Chart. Learn to gather, bind, and visualize data effectively while customizing chart elements for improved readability.
Welcome to the Chart of the Week blog series!
Today, we’ll visualize the global renewable energy employment trends using the Syncfusion .NET MAUI Bar Chart (Transposed Column Chart).
Renewable energy plays a vital role in the global energy landscape, providing sustainable solutions to meet our ever-increasing energy demands. Understanding the employment trends in the renewable energy sector offers valuable insights into its growth and impact.
The following image demonstrates the chart that we intend to construct.
 Let’s explore the steps to visualize and understand the global renewable energy employment trends in 2022 using the Syncfusion .NET MAUI Bar Chart.
Step 1: Gathering the renewable energy employment data
Before proceeding, we should gather the renewable energy employment data for various technologies from the IRENA Report to use in our bar chart.
Step 2: Populate the data for the chart
Define the JobsModel class with the following properties:
- Technology – Represents the different technologies used in renewable energy production.
- Jobs – Represents the number of jobs available in each respective technology.
public class JobsModel
{
    public string? Technology { get; set; }
    public double Jobs { get; set; }
}
Now, generate the data collection that illustrates the renewable energy employment trends using the JobsViewModel class with the EmploymentDetails property.
Refer to the following code example.
public class JobsViewModel
{
public ObservableCollection<JobsModel> EmploymentDetails { get; set; }
public JobsViewModel()
{
EmploymentDetails = new ObservableCollection<JobsModel>()
{
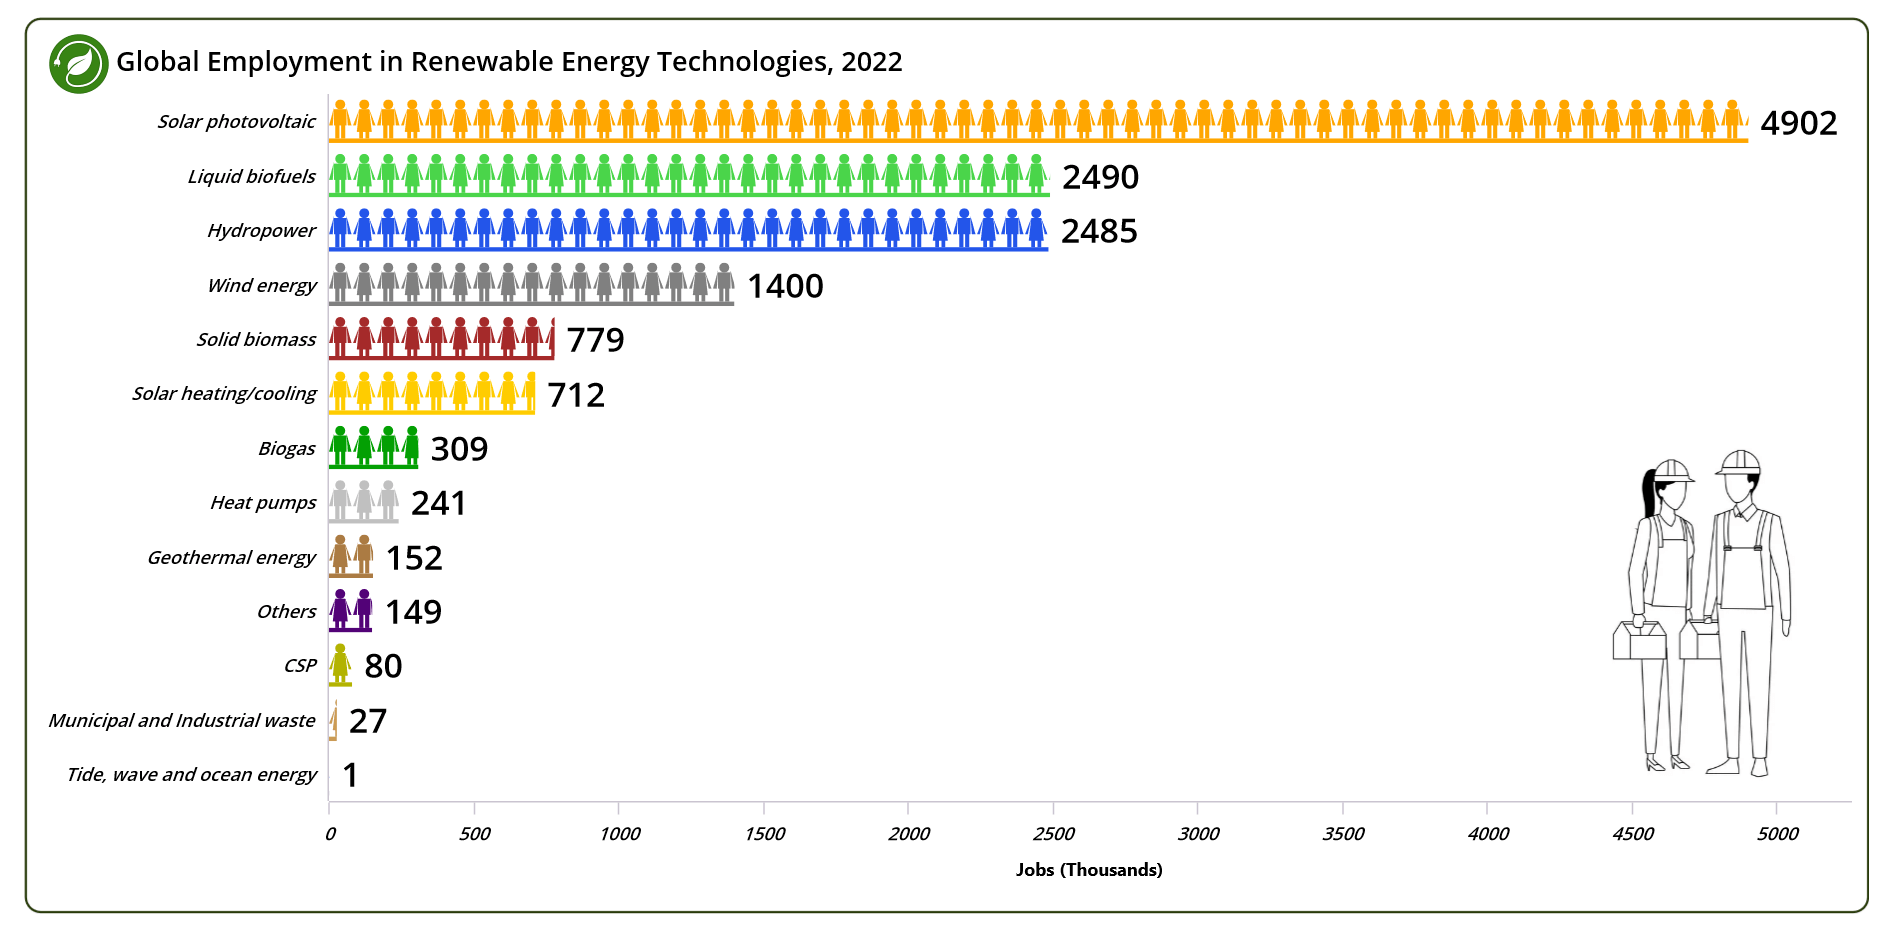
new JobsModel() { Technology = "Tide, wave and ocean energy", Jobs = 1},
new JobsModel() { Technology = "Municipal and Industrial waste", Jobs = 27},
new JobsModel() { Technology = "CSP", Jobs = 80},
new JobsModel() { Technology = "Others", Jobs = 149},
new JobsModel() { Technology = "Geothermal energy", Jobs = 152},
new JobsModel() { Technology = "Heat pumps", Jobs = 241},
new JobsModel() { Technology = "Biogas", Jobs = 309},
new JobsModel() { Technology = "Solar heating/cooling", Jobs = 712},
new JobsModel() { Technology = "Solid biomass", Jobs = 779},
new JobsModel() { Technology = "Wind energy", Jobs = 1400},
new JobsModel() { Technology = "Hydropower", Jobs = 2485},
new JobsModel() { Technology = "Liquid biofuels", Jobs = 2490},
new JobsModel() { Technology = "Solar photovoltaic", Jobs = 4902},
};
}
}Step 3: Configure the Syncfusion .NET MAUI Cartesian Charts
Let’s configure the Syncfusion .NET MAUI Cartesian Charts control using this documentation.
In our case, we need to update the x-axis to reflect the various renewable energy technologies; therefore, we will use a CategoryAxis for the XAxes. Since we use numerical values on the Y-axis to represent job counts, we will employ a NumericalAxis for the YAxes.
<chart:SfCartesianChar>
   <chart:SfCartesianChart.XAxes>
       <chart:CategoryAxis>
       </chart:CategoryAxis>
   </chart:SfCartesianChart.XAxes>
   <chart:SfCartesianChart.YAxes>
       <chart:NumericalAxis>
       </chart:NumericalAxis>
   </chart:SfCartesianChart.YAxes>
</chart:SfCartesianChart>
Step 4: Bind the renewable energy employment data to the .NET MAUI Bar Chart
A bar chart also called a transposed column chart, uses bars to represent data points and compare values across different categories. To render a bar chart, initialize the SfCartesianChart and set the IsTransposed property to True to switch the chart’s X and Y axes.
<chart:SfCartesianChart IsTransposed="True">
Then, create a column chart to display the details of renewable energy employment across various technologies. In our case, we want a customized column chart with a customized segment. Therefore, initialize the column chart and segment it accordingly in the code-behind.
Refer to the following code example and utilize a customized column instance to bind the data to the chart.
public class ColumnSeriesExt : ColumnSeries
{
}
public class ColumnSegmentExt : ColumnSegment
{

}
Use the customized column instance to bind the data to the chart. Bind the EmploymentDetails collection to the ItemSource property. The XBindingPath and YBindingPath properties should be bound with the Technology and Jobs properties, respectively.
…
<local:ColumnSeriesExt ItemsSource="{Binding EmploymentDetails}" XBindingPath="Technology" YBindingPath="Jobs">

</local:ColumnSeriesExt>

</chart:SfCartesianChart>
Step 5: Customize the column chart segments
Refer to the following code example. Here, the ColumnSeriesExt class extends the standard ColumnSeries and overrides the CreateSegment method. This method is crucial because it determines the creation of a custom ColumnSegmentExt instance, allowing the chart to display specialized segments.
The ColumnSegmentExt class, which inherits from ColumnSegment, contains the drawing path logic for male and female vectors in the custom column segment.
public class ColumnSeriesExt : ColumnSeries
{
        protected override ChartSegment CreateSegment()
        {
            return new ColumnSegmentExt();
        }
}

public class ColumnSegmentExt : ColumnSegment
{
   int innerRectCount = 1;
   float innerRectHalfWidth = 0;
   float pathHeadRadius = 0;
   protected override void Draw(ICanvas canvas)
   {
      if (Series is ChartSeries series && series.BindingContext is JobsViewModel viewModel)
      {
        RectF segmentRect = new RectF(Left, Top, Right - Left, Bottom - Top);

        canvas.SaveState();
        canvas.ClipRectangle(segmentRect);
        RectF rect = new RectF() { X = Left, Y = Top, Width = Right - Left, Height = Bottom - Top - viewModel.bottomRectHeight };
        Brush segmentColor = series.PaletteBrushes[Index];
        RectF innerRect = new RectF() { X = rect.X, Y = rect.Y, Width = viewModel.innerRectWidth, Height = rect.Height };

        for (float i = innerRect.X; i < rect.Width; i++)
        {
            innerRect.X = i;
            i += innerRect.Width;
            innerRectHalfWidth = innerRect.X + innerRect.Width / 2;
            pathHeadRadius = innerRect.Width / 4.5f;

            canvas.SaveState();
            PathF path = new PathF();

            if (innerRectCount % 2 != 0)
            {
                DrawFemalePath(innerRect, innerRectHalfWidth, pathHeadRadius, ref path);
            }
            else
            {
                DrawMalePath(innerRect, innerRectHalfWidth, pathHeadRadius, ref path);
            }

            canvas.SetFillPaint(segmentColor, innerRect);
            canvas.FillCircle(innerRectHalfWidth, innerRect.Y + pathHeadRadius, pathHeadRadius);
            canvas.FillPath(path);
            canvas.RestoreState();
            innerRectCount++;
        }

        RectF bottomRect = new RectF(rect.X, rect.Bottom, rect.Width, viewModel.bottomRectHeight);
        canvas.SetFillPaint(segmentColor, bottomRect);
        canvas.FillRectangle(bottomRect);
        canvas.RestoreState();
     }
  }
  private void DrawFemalePath(RectF innerRect, float innerRectHalfWidth, float pathHeadRadius, ref PathF path)
  {
            //To draw a female dress detail
            path.MoveTo(innerRectHalfWidth - pathHeadRadius, innerRect.Y + (innerRect.Height / 4));
            path.LineTo(innerRectHalfWidth + pathHeadRadius, innerRect.Y + (innerRect.Height / 4));
            path.LineTo(innerRectHalfWidth + (innerRect.Width / 3), innerRect.Bottom - (innerRect.Height / 6));
            path.LineTo(innerRectHalfWidth - (innerRect.Width / 3), innerRect.Bottom - (innerRect.Height / 6));
            path.Close();
            //To draw a female right leg
            path.MoveTo(innerRectHalfWidth - (pathHeadRadius / 4), innerRect.Bottom - (innerRect.Height / 6));
            path.LineTo(innerRectHalfWidth - (pathHeadRadius / 4), innerRect.Bottom);
            path.LineTo(innerRectHalfWidth - pathHeadRadius, innerRect.Bottom);
            path.LineTo(innerRectHalfWidth - pathHeadRadius, innerRect.Bottom - (innerRect.Height / 6));
            path.Close();
            //To draw a female left leg
            path.MoveTo(innerRectHalfWidth + (pathHeadRadius / 4), innerRect.Bottom - (innerRect.Height / 6));
            path.LineTo(innerRectHalfWidth + (pathHeadRadius / 4), innerRect.Bottom);
            path.LineTo(innerRectHalfWidth + pathHeadRadius, innerRect.Bottom);
            path.LineTo(innerRectHalfWidth + pathHeadRadius, innerRect.Bottom - (innerRect.Height / 6));
            path.Close();
            //To draw a female right arm
            path.MoveTo(innerRectHalfWidth - pathHeadRadius, innerRect.Y + (innerRect.Height / 4));
            path.LineTo(innerRect.X, innerRect.Bottom - (innerRect.Height / 3));
            path.LineTo(innerRect.X + (float)(innerRect.Width / 8), innerRect.Bottom - (innerRect.Height / 3));
            ////To draw a female left arm
            path.MoveTo(innerRectHalfWidth + pathHeadRadius, innerRect.Y + (innerRect.Height / 4));
            path.LineTo(innerRect.Right, innerRect.Bottom - (innerRect.Height / 3));
            path.LineTo(innerRect.Right - (float)(innerRect.Width / 8), innerRect.Bottom - (innerRect.Height / 3));
   }

   private void DrawMalePath(RectF innerRect, float innerRectHalfWidth, float pathHeadRadius, ref PathF path)
   {
            //To draw a male dress detail
            path.MoveTo(innerRectHalfWidth - (pathHeadRadius / 4 + pathHeadRadius), innerRect.Y + (innerRect.Height / 4));
            path.LineTo(innerRectHalfWidth + (pathHeadRadius / 4 + pathHeadRadius), innerRect.Y + (innerRect.Height / 4));
            path.LineTo(innerRectHalfWidth + (pathHeadRadius / 4 + pathHeadRadius), innerRect.Bottom - (innerRect.Height / 3));
            path.LineTo(innerRectHalfWidth - (pathHeadRadius / 4 + pathHeadRadius), innerRect.Bottom - (innerRect.Height / 3));
            path.Close();
            //To draw a male right leg
            path.MoveTo(innerRectHalfWidth - (pathHeadRadius / 6), innerRect.Bottom - (innerRect.Height / 3));
            path.LineTo(innerRectHalfWidth - (pathHeadRadius / 6), innerRect.Bottom);
            path.LineTo(innerRectHalfWidth - pathHeadRadius, innerRect.Bottom);
            path.LineTo(innerRectHalfWidth - pathHeadRadius, innerRect.Bottom - (innerRect.Height / 3));
            path.Close();
            //To draw a male left leg
            path.MoveTo(innerRectHalfWidth + (pathHeadRadius / 6), innerRect.Bottom - (innerRect.Height / 3));
            path.LineTo(innerRectHalfWidth + (pathHeadRadius / 6), innerRect.Bottom);
            path.LineTo(innerRectHalfWidth + pathHeadRadius, innerRect.Bottom);
            path.LineTo(innerRectHalfWidth + pathHeadRadius, innerRect.Bottom - (innerRect.Height / 3));
            path.Close();
            //To draw a male right arm
            path.MoveTo(innerRectHalfWidth - (pathHeadRadius / 4 + pathHeadRadius), innerRect.Y + (innerRect.Height / 5));
            path.LineTo(innerRect.X, innerRect.Bottom - (innerRect.Height / 3));
            path.LineTo(innerRect.X + (float)(innerRect.Width / 6), innerRect.Bottom - (innerRect.Height / 3));
            //To draw a male left arm
            path.MoveTo(innerRectHalfWidth + (pathHeadRadius / 4 + pathHeadRadius), innerRect.Y + (innerRect.Height / 5));
            path.LineTo(innerRect.Right, innerRect.Bottom - (innerRect.Height / 3));
            path.LineTo(innerRect.Right - (float)(innerRect.Width / 6), innerRect.Bottom - (innerRect.Height / 3));
    }
}
Step 6: Customize the .NET MAUI Bar Chart appearance
Let’s customize the appearance of the .NET MAUI Bar Chart to enhance the readability of the data.
Adding the chart title
Incorporating a title into the chart enhances the clarity of the presented data. Refer to the following code example to customize the chart title.
<chart:SfCartesianChart.Title>
    <HorizontalStackLayout>
        <Image Source="icon.png" Margin="{OnPlatform Default='5,0,5,0', Android='0,0,5,0', iOS='0,0,5,0'}"
            HeightRequest="{OnPlatform Android=30, Default=40, iOS= 40}"/>
        <Label Text="Global Employment in Renewable Energy Technologies, 2022"
               FontFamily="OpenSansSemibold" Margin="{OnPlatform Default='0,0,0,5', Android='0', iOS='0'}"
               HorizontalOptions="Center" HorizontalTextAlignment="Center"
               VerticalOptions="Center" FontSize="{OnPlatform Default=18, iOS=22, MacCatalyst=24}" TextColor="Black"/>
    </HorizontalStackLayout>
</chart:SfCartesianChart.Title>
Customizing the chart axis
To customize the chart axis, we’ll use the following properties:
- EdgeLabelsDrawingMode: To customize the rendering position of the edge axis labels.
- LabelPlacement: To place the category axis labels based on ticks and between ticks.
- ShowMajorGridLines: To customize the visibility of the major grid lines.
- LabelStyle: To customize the style of the axis labels.
- Minimum, Interval, and Maximum: To customize the axis range.
- ShowMinorGridLines: To customize the visibility of the minor grid lines.
- PlotOffsetEnd: To provide padding to the axis at the end position.
- Title: To customize the appearance of the axis title.
XAML
<chart:SfCartesianChart.XAxes>

    <chart:CategoryAxis EdgeLabelsDrawingMode="Shift" LabelPlacement="BetweenTicks" ShowMajorGridLines="False">

        <chart:CategoryAxis.MajorTickStyle>
            <chart:ChartAxisTickStyle StrokeWidth="0"/>
        </chart:CategoryAxis.MajorTickStyle>

        <chart:CategoryAxis.LabelStyle>
            <chart:ChartAxisLabelStyle Margin="{OnPlatform WinUI='0,4,4,0',Android='0',MacCatalyst='0,4,0,0',iOS='0, 4, 0, 0'}"
                                       FontSize="{OnPlatform MacCatalyst=20, iOS=15}"  TextColor="Black"
                                       FontFamily="{OnPlatform WinUI=OpenSansSemibold, iOS=OpenSansSemibold, Android=OpenSansSemibold }"
                                       FontAttributes="Italic"/>
        </chart:CategoryAxis.LabelStyle>

    </chart:CategoryAxis>
</chart:SfCartesianChart.XAxes>

<chart:SfCartesianChart.YAxes>

    <chart:NumericalAxis x:Name="yAxis" Minimum="0" Interval="500" Maximum="5000"
                  ShowMajorGridLines="False" EdgeLabelsDrawingMode="Center"
                  ShowMinorGridLines="False" PlotOffsetEnd="50">

        <chart:NumericalAxis.LabelStyle>
            <chart:ChartAxisLabelStyle x:Name="labelStyle" TextColor="Black" FontAttributes="Italic"
                                       FontSize="{OnPlatform MacCatalyst=20, iOS=15}" FontFamily="OpenSansSemibold" />
        </chart:NumericalAxis.LabelStyle>

    </chart:NumericalAxis>
</chart:SfCartesianChart.YAxes>
C#
public partial class MainPage : ContentPage
{
       public MainPage()
       {
           InitializeComponent();

           #if !ANDROID && !IOS
           ChartAxisTitle title = new ChartAxisTitle()
           {
                Text = "Jobs (Thousands)",
                FontAttributes = FontAttributes.Bold,
                TextColor = Colors.Black,
                FontSize = labelStyle.FontSize,
           };
          yAxis.Title = title;
          #endif
       }
}
Customizing the chart series
We can enhance the appearance of the chart series by setting the PaletteBrushes property to each series. This will apply pre-defined brushes to the segments.
XAML
<local:ColumnSeriesExt PaletteBrushes="{Binding SeriesPaletteBrushes}">

</local:ColumnSeriesExt>
C#
public class JobsViewModel
{
    public ObservableCollection<Brush> SeriesPaletteBrushes { get; set; }

    public JobsViewModel()
    {
        SeriesPaletteBrushes = new ObservableCollection<Brush>()
            {
                new SolidColorBrush(Color.FromArgb("#3a6baa")),
                new SolidColorBrush(Color.FromArgb("#cb9b55")),
                new SolidColorBrush(Color.FromArgb("#b3b300")),
                new SolidColorBrush(Color.FromArgb("#520277")),
                new SolidColorBrush(Color.FromArgb("#ab7b43")),
                new SolidColorBrush(Color.FromArgb("#c0c0c0")),
                new SolidColorBrush(Color.FromArgb("#03a003")),
                new SolidColorBrush(Color.FromArgb("#ffcc00")),
                new SolidColorBrush(Color.FromArgb("#a52a2a")),
                new SolidColorBrush(Color.FromArgb("#808080")),
                new SolidColorBrush(Color.FromArgb("#2355ea")),
                new SolidColorBrush(Color.FromArgb("#4ad54a")),
                new SolidColorBrush(Color.FromArgb("#ffa600")),
            };
    }
}
Adding data labels
Let’s add data labels to the chart using the ShowDataLabels property. In the following code example, the data labels show information about the renewable energy job counts in thousands.
<local:ColumnSeriesExt ShowDataLabels="True">

   <chart:ColumnSeries.DataLabelSettings>
    <chart:CartesianDataLabelSettings LabelPlacement="Outer" UseSeriesPalette="False">

        <chart:CartesianDataLabelSettings.LabelStyle>
            <chart:ChartDataLabelStyle FontSize="{OnPlatform MacCatalyst=20, iOS=18, Default=Medium}"
                  FontFamily="{OnPlatform WinUI=OpenSansSemibold, Android=OpenSansSemibold }"/>
        </chart:CartesianDataLabelSettings.LabelStyle>

    </chart:CartesianDataLabelSettings>
   </chart:ColumnSeries.DataLabelSettings>
</local:ColumnSeriesExt>
Incorporating a plot area background view
Finally, incorporate a plot area background view to make our Bar Chart more informative and attractive. This allows us to add any view to the chart plot area to include relevant data.
<chart:SfCartesianChart.PlotAreaBackgroundView>
    <AbsoluteLayout>
        <Image Source="background.jpg"
               AbsoluteLayout.LayoutBounds="1, 1,-1,-1"
               AbsoluteLayout.LayoutFlags="PositionProportional"
               HeightRequest="{OnPlatform Android=150,iOS=200, MacCatalyst=400, Default=250}"
               WidthRequest="{OnPlatform Android=150,iOS=150, MacCatalyst=300, Default=200}"/>
    </AbsoluteLayout>
</chart:SfCartesianChart.PlotAreaBackgroundView>
After executing the previous code examples, the output will resemble the following image.
GitHub reference
Also, refer to Creating a custom .NET MAUI Bar Chart for global renewable energy employment trends GitHub demo.

Conclusion
Thanks for reading! In this blog, we have explored how to visualize global renewable energy employment trends across various technologies in 2022 using the Syncfusion .NET MAUI Bar Chart. Please follow the steps outlined in this blog and share your feedback in the comments section below.
Existing customers can download the new version of Essential Studio from the License and Downloads page. If you still need to become a Syncfusion customer, try our 30-day free trial to check out our incredible features.
If you require assistance, please don’t hesitate to contact us via our support forum, support portal, or feedback portal. We are always eager to help you!