
Blazor Maps: An Overview
The Syncfusion Blazor Maps library is a powerful tool that allows developers to create interactive maps easily. It provides rich features, including markers, data labels, tooltips, and more. However, one of its most distinguishing features is its layered structure.
This blog will delve into the concept of layers and sublayers within the Blazor Maps library. We will explore how these layers create complex and interactive maps. We will also discuss how to manipulate them to customize your maps.
Layers and Sublayers in Blazor Maps
The Syncfusion Blazor Maps library is a versatile UI component that can display various maps. It can render:
- Any country, continent, or world map using geometric shapes.
- Custom-designed geometry shapes include building floor plans, land layout designs, and ticket and booking systems.
- Tile images from online maps provide tile services such as Bing Maps, OpenStreetMap, and MapBox.
Our Syncfusion Blazor Maps library accurately places these geometric shapes and tile images in the main layer. You can draw a sublayer on top of the main layer using geometric or polygon shapes with appropriate coordinates and measurements.
Let’s explore how to achieve these with code examples.
Showing geometric shapes as a sublayer
Let’s define the geometric shapes using a JSON-based open standard format that encodes geographical data structures. This format is commonly used to represent geographical features such as points, lines, and polygons and their associated attributes. We recognize it as the GeoJSON file with the *.json extension.
The following is what the format of the GeoJSON would look like.
{
  "type": "FeatureCollection",
  "features": [
    {
      "type": "Feature",
      "properties": {
        "name": "Germany"
      },
      "geometry": {
        "coordinates": [
          [
            [
              8.64898681640625,
              54.909777539554824
            ],
            [
              8.5638427734375,
              54.90030293114211
            ],
            [
              8.59130859375,
              54.8086000512159
            ]
			//..
                     //..
		      //..
            [
              8.64898681640625,
              54.909777539554824
            ]
          ]
        ],
        "type": "Polygon"
      }
    }
  ]
}
Let’s explore how to overlay the geometric shapes as a sublayer on top of a main layer in Case 1 and how to overlay them as a sublayer on top of tile images obtained from online map providers in Case 2.
Case 1
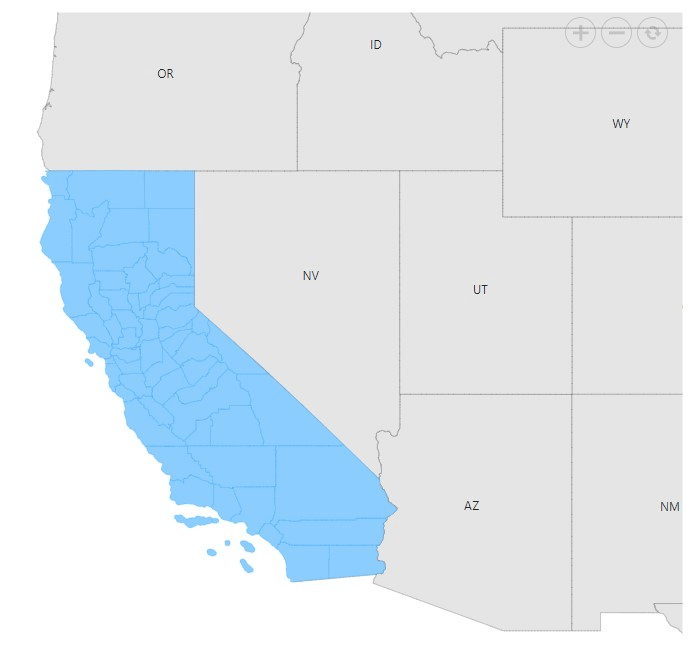
This section will use the USA map as the main layer, rendered using a GeoJSON file (geometric shape). We will then visualize the county map of the state of California, rendered using a separate GeoJSON file (geometric shape), as a sublayer on top of the main layer.
Refer to the following code example.
<SfMaps Height="700px" Background="transparent">
 <MapsAreaSettings Background="transparent" />
 <MapsCenterPosition Latitude="37.768253245440846" Longitude="-108.65245386980939">
 </MapsCenterPosition>
 <MapsZoomSettings Enable="true" ZoomFactor="2" />
 <MapsLayers>
  <MapsLayer ShapeData='new {dataOptions = "https://cdn.syncfusion.com/maps/map-data/usa.json"}' TValue="string">
   <MapsShapeSettings Fill="#E5E5E5">
    <MapsShapeBorder Color="#000000" Width="0.2" />
   </MapsShapeSettings>
   <MapsDataLabelSettings Visible="true" LabelPath="iso_3166_2" SmartLabelMode="SmartLabelMode.Hide">
    <MapsLayerDataLabelTextStyle FontFamily="Segoe UI" Color="#212529"> </MapsLayerDataLabelTextStyle>
   </MapsDataLabelSettings>
  </MapsLayer>
  <MapsLayer ShapeData='new {dataOptions ="https://cdn.syncfusion.com/maps/map-data/california.json"}' Type="Syncfusion.Blazor.Maps.Type.SubLayer" TValue="string">
   <MapsShapeSettings Fill="#8ccdff">
    <MapsShapeBorder Color="#1a9cff" Width="0.25" />
   </MapsShapeSettings>
  </MapsLayer>
 </MapsLayers>
</SfMaps>
Refer to the following output image.
Case 2
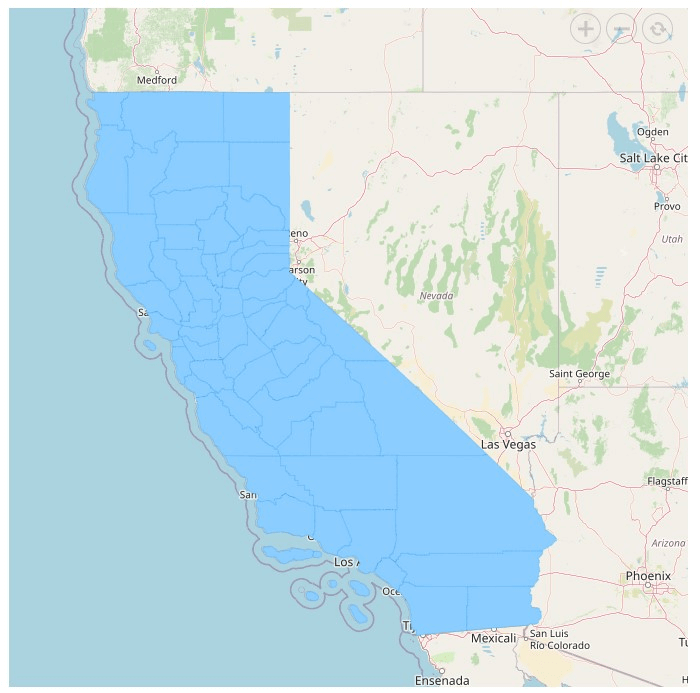
In this section, we will use OpenStreetMap to render the USA map as a tile image. We’ll zoom in by default to see the USA map. Following that, we will visualize the California counties in it, which can be rendered using a separate GeoJSON file (geometry shape) as a sublayer on top of the tile image. Please note that the vice versa is not possible here.
Refer to the following code example.
<SfMaps Height="750px" Background="transparent">
 <MapsAreaSettings Background="transparent" />
 <MapsCenterPosition Latitude="37.435921257933" Longitude="-110.59530280178286"></MapsCenterPosition>
 <MapsZoomSettings Enable="true" ZoomFactor="6" />
 <MapsLayers>
  <MapsLayer UrlTemplate="https://tile.openstreetmap.org/level/tileX/tileY.png" TValue="string"></MapsLayer>
  <MapsLayer ShapeData='new {dataOptions ="https://cdn.syncfusion.com/maps/map-data/california.json"}' Type="Syncfusion.Blazor.Maps.Type.SubLayer" TValue="string">
   <MapsShapeSettings Fill="#8ccdff">
    <MapsShapeBorder Color="#1a9cff" Width="0.25" />
   </MapsShapeSettings>
  </MapsLayer>
 </MapsLayers>
</SfMaps>
Refer to the following output image.
Showing polygon shapes as sublayer
In geographical data representation, a polygon shape is an area enclosed by a closed path, defined by a set of coordinates, typically expressed in latitudes and longitudes.
The format of a polygon shape is quite straightforward. It is represented as a series of coordinates that define the polygon’s vertices. When you connect these points in the order they appear and link the final point back to the first, it will form a closed polygon shape.
This simple yet powerful representation enables the depiction of complex geographical features, from a city’s boundaries to a lake’s contours. Let’s explore the structure of a polygon shape with a code example.
"polygons": [
    {
        "points": [
            { "longitude": 8.64898681640625, "latitude": 54.909777539554824 },
            { "longitude": 8.5638427734375, "latitude": 54.90030293114211 },
            { "longitude": 8.59130859375, "latitude": 54.8086000512159 },
            //...
            //...
            { "longitude": 8.64898681640625, "latitude": 54.909777539554824 }
        ],
        "fill": "#1A7951",
        "opacity": 0.7,
        "borderWidth": 7,
        "borderColor": "#1A7951",
        "borderOpacity": 1
    },
    //..
    //..
]
Let’s explore the process of overlaying a polygon shape as a sublayer on different base layers. We will examine two cases: one where we use a geometric shape as the base layer and another where we use tile images from online map providers.
Case 1
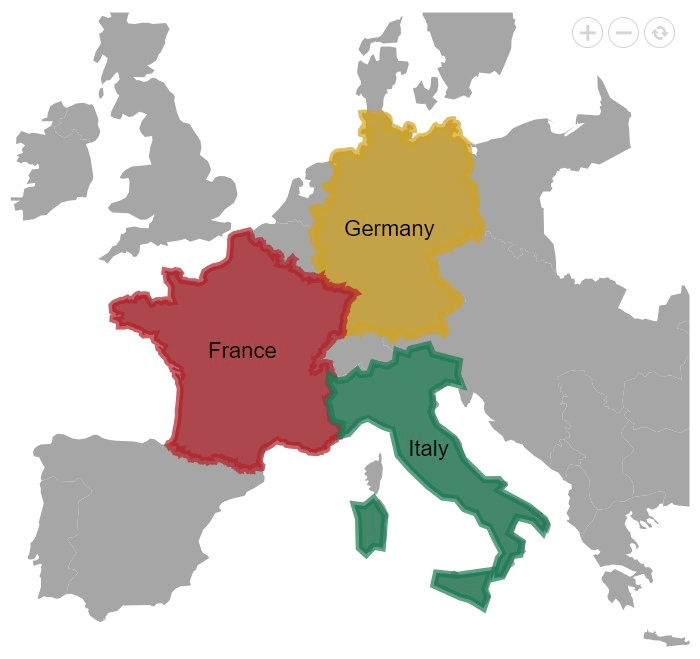
In this case, we’ll use the Europe map as our primary layer, which we render from a GeoJSON file (geometric shape). We aim to highlight the top three GDP contributors in the European Union: Germany, France, and Italy. We will represent these countries using polygon shapes and overlay them as sublayers on the main map.
Refer to the following code example.
<SfMaps Height="700px">
 <MapsZoomSettings Enable="true" ZoomFactor="3" />
 <MapsCenterPosition Latitude="47.24515117294152" Longitude="7.371116586176754"></MapsCenterPosition>
 <MapsLayers>
  <MapsLayer ShapeData='new {dataOptions= "Europe.json"}' TValue="string"></MapsLayer>
  <MapsLayer ShapeData='new {dataOptions = "GermanyShape.json"}'
             Type="Syncfusion.Blazor.Maps.Type.SubLayer" TValue="string">
   <MapsPolygons>
    <MapsPolygon Points="GermanyPoints" Fill="#D1A121" Opacity="0.7" BorderColor="#D1A121" BorderWidth="7" BorderOpacity="1"></MapsPolygon>
   </MapsPolygons>
   <MapsDataLabelSettings Visible="true" LabelPath="name">
    <MapsLayerDataLabelTextStyle Color="Black" Size="22px" FontStyle="Sans-serif" FontWeight="normal">
    </MapsLayerDataLabelTextStyle>
   </MapsDataLabelSettings>
  </MapsLayer>
  <MapsLayer ShapeData='new {dataOptions = "FranceShape.json"}'
             Type="Syncfusion.Blazor.Maps.Type.SubLayer" TValue="string">
   <MapsPolygons>
    <MapsPolygon Points="FrancePoints" Fill="#B11F29" Opacity="0.7" BorderColor="#B11F29" BorderWidth="7" BorderOpacity="1"></MapsPolygon>
   </MapsPolygons>
   <MapsDataLabelSettings Visible="true" LabelPath="name">
    <MapsLayerDataLabelTextStyle Color="Black" Size="22px" FontStyle="Sans-serif" FontWeight="normal">
    </MapsLayerDataLabelTextStyle>
   </MapsDataLabelSettings>
  </MapsLayer>
  <MapsLayer ShapeData='new {dataOptions = "ItalyShape.json"}'
             Type="Syncfusion.Blazor.Maps.Type.SubLayer" TValue="string">
   <MapsPolygons>
    <MapsPolygon Points="ItalyPointsOne" Fill="#1A7951" Opacity="0.7" BorderColor="#1A7951" BorderWidth="7" BorderOpacity="1"></MapsPolygon>
    <MapsPolygon Points="ItalyPointsTwo" Fill="#1A7951" Opacity="0.7" BorderColor="#1A7951" BorderWidth="7" BorderOpacity="1"></MapsPolygon>
    <MapsPolygon Points="ItalyPointsThree" Fill="#1A7951" Opacity="0.7" BorderColor="#1A7951" BorderWidth="7" BorderOpacity="1"></MapsPolygon>
   </MapsPolygons>
   <MapsDataLabelSettings Visible="true" LabelPath="name">
    <MapsLayerDataLabelTextStyle Color="Black" Size="22px" FontStyle="Sans-serif" FontWeight="normal">
    </MapsLayerDataLabelTextStyle>
   </MapsDataLabelSettings>
  </MapsLayer>
 </MapsLayers>
</SfMaps>

@code {
    List<Coordinate> GermanyPoints = new List<Coordinate>();
    List<Coordinate> FrancePoints = new List<Coordinate>();
    List<Coordinate> ItalyPointsOne = new List<Coordinate>();
    List<Coordinate> ItalyPointsTwo = new List<Coordinate>();
    List<Coordinate> ItalyPointsThree = new List<Coordinate>();

    protected override async Task OnInitializedAsync()
    {
        await base.OnInitializedAsync();
        ItalyPointsOne.Add(new Coordinate() { Longitude = 12.376485, Latitude = 46.767559 });
        //..
        //..
        ItalyPointsTwo.Add(new Coordinate() {  Longitude = 15.520376, Latitude = 38.231155 });
        //..
        //..
        ItalyPointsThree.Add(new Coordinate() { Longitude = 9.210012, Latitude = 41.209991 });
        //..
        //..
        FrancePoints.Add(new Coordinate() { Longitude = 2.5350952148436363, Latitude = 51.10007257240614 });
        //..
        //..
        GermanyPoints.Add(new Coordinate() { Longitude = 8.64898681640625, Latitude = 54.909777539554824 });
        //..
        //..
    }
}
Refer to the following output image.
Case 2
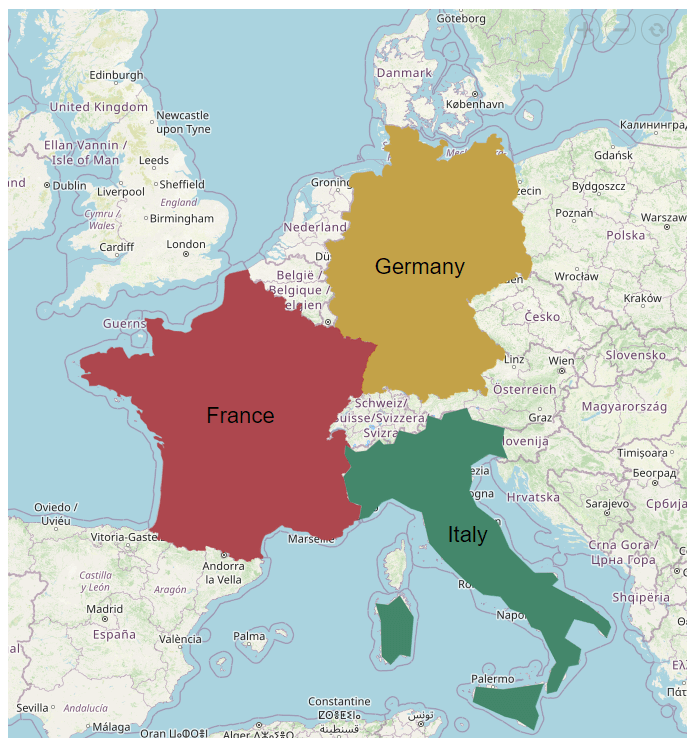
In this section, we will use OpenStreetMap to render the European Union map as the tile image. We’ll zoom in by default to see the Europe map. Following that, we will visualize the top three GDP contributors in the European Union, which will be rendered using the polygon shape definition as a sublayer on top of the tile image. Please note that the vice versa is not possible here.
Refer to the following code example.
<SfMaps Height="750px">
 <MapsZoomSettings Enable="true" ZoomFactor="5" />
 <MapsCenterPosition Latitude="47.24515117294152" Longitude="7.371116586176754"></MapsCenterPosition>
 <MapsLayers>
  <MapsLayer UrlTemplate="https://tile.openstreetmap.org/level/tileX/tileY.png" TValue="string"></MapsLayer>
  <MapsLayer ShapeData='new {dataOptions = "GermanyShape.json"}'
             Type="Syncfusion.Blazor.Maps.Type.SubLayer" TValue="string">
   <MapsPolygons>
    <MapsPolygon Points="GermanyPoints" Fill="#D1A121" Opacity="0.7" BorderColor="#D1A121" BorderWidth="7" BorderOpacity="1"></MapsPolygon>
    </MapsPolygons>
     <MapsDataLabelSettings Visible="true" LabelPath="name">
      <MapsLayerDataLabelTextStyle Color="Black" Size="22px" FontStyle="Sans-serif" FontWeight="normal">
      </MapsLayerDataLabelTextStyle>
     </MapsDataLabelSettings>
    </MapsLayer>
    <MapsLayer ShapeData='new {dataOptions = "FranceShape.json"}'
               Type="Syncfusion.Blazor.Maps.Type.SubLayer" TValue="string">
   <MapsPolygons>
    <MapsPolygon Points="FrancePoints" Fill="#B11F29" Opacity="0.7" BorderColor="#B11F29" BorderWidth="7" BorderOpacity="1"></MapsPolygon>
   </MapsPolygons>
   <MapsDataLabelSettings Visible="true" LabelPath="name">
    <MapsLayerDataLabelTextStyle Color="Black" Size="22px" FontStyle="Sans-serif" FontWeight="normal">
    </MapsLayerDataLabelTextStyle>
   </MapsDataLabelSettings>
  </MapsLayer>
  <MapsLayer ShapeData='new {dataOptions = "ItalyShape.json"}'
             Type="Syncfusion.Blazor.Maps.Type.SubLayer" TValue="string">
   <MapsPolygons>
    <MapsPolygon Points="ItalyPointsOne" Fill="#1A7951" Opacity="0.7" BorderColor="#1A7951" BorderWidth="7" BorderOpacity="1"></MapsPolygon>
    <MapsPolygon Points="ItalyPointsTwo" Fill="#1A7951" Opacity="0.7" BorderColor="#1A7951" BorderWidth="7" BorderOpacity="1"></MapsPolygon>
    <MapsPolygon Points="ItalyPointsThree" Fill="#1A7951" Opacity="0.7" BorderColor="#1A7951" BorderWidth="7" BorderOpacity="1"></MapsPolygon>
   </MapsPolygons>
   <MapsDataLabelSettings Visible="true" LabelPath="name">
    <MapsLayerDataLabelTextStyle Color="Black" Size="22px" FontStyle="Sans-serif" FontWeight="normal">
    </MapsLayerDataLabelTextStyle>
   </MapsDataLabelSettings>
  </MapsLayer>
 </MapsLayers>
</SfMaps>

@code {
    List<Coordinate> GermanyPoints = new List<Coordinate>();
    List<Coordinate> FrancePoints = new List<Coordinate>();
    List<Coordinate> ItalyPointsOne = new List<Coordinate>();
    List<Coordinate> ItalyPointsTwo = new List<Coordinate>();
    List<Coordinate> ItalyPointsThree = new List<Coordinate>();

    protected override async Task OnInitializedAsync()
    {
        await base.OnInitializedAsync();
        ItalyPointsOne.Add(new Coordinate() { Longitude = 12.376485, Latitude = 46.767559 });
        //..
        //..
        ItalyPointsTwo.Add(new Coordinate() {  Longitude = 15.520376, Latitude = 38.231155 });
        //..
        //..
        ItalyPointsThree.Add(new Coordinate() { Longitude = 9.210012, Latitude = 41.209991 });
        //..
        //..
        FrancePoints.Add(new Coordinate() { Longitude = 2.5350952148436363, Latitude = 51.10007257240614 });
        //..
        //..
        GermanyPoints.Add(new Coordinate() { Longitude = 8.64898681640625, Latitude = 54.909777539554824 });
        //..
        //..
    }
}
Refer to the following output image.
References
For more information, you can check out the following:
- Layers in Blazor Maps documentation
- Multi-layers in Blazor Maps online demo
- Creating layers and sub-layers in Blazor Maps GitHub demo
Conclusion
Thank you for joining us on this journey! We’ve explored the layer and sublayer features in our Syncfusion Blazor Maps component. We encourage you to experiment with these features and discover the useful visualizations you can create with our Blazor Maps!
For our existing customers, the latest version of our Blazor components is ready for download on the License and Downloads page. If you’re new to Syncfusion, we offer a 30-day free trial to explore the range of features available.
If you have questions, you can contact us through our support forums, support portal, or feedback portal. We’re always happy to help you!

