

We’re proud to present Syncfusion’s latest offering—the .NET MAUI Sunburst Chart control. This great new tool is available in the Essential Studio® 2023 Volume 4 release.
The Sunburst Chart control is a powerful enhancement that brings hierarchical data to life in a visually appealing way. This tool transforms complex data structures into vibrant, easy-to-understand charts.
In this blog, we’ll take a closer look at the standout features of the .NET MAUI Sunburst Chart control and the steps to get started with it.
Key features
The key features of the .NET MAUI Sunburst Chart are:
Showcase hierarchical data
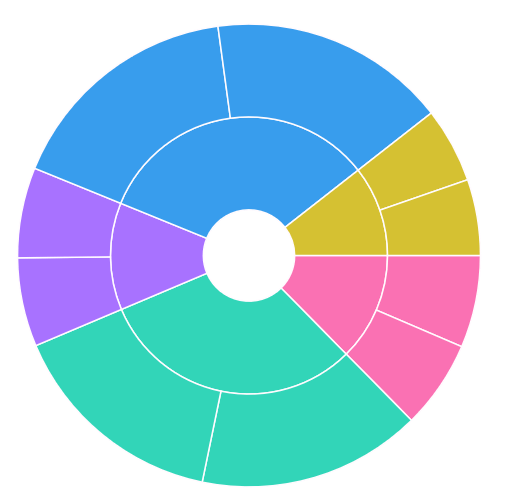
The Sunburst Chart control is designed to display hierarchical data structures elegantly. Its radial layout offers a clear, interactive, visually appealing data representation. This layout allows users to navigate various levels of data, providing a comprehensive view of the entire hierarchy at a glance.
This makes the Sunburst Chart control ideal for visualizing a wide range of hierarchical data. Whether it’s an organizational structure, category hierarchies, or complex nested data, the Sunburst Chart can transform these structures into engaging charts.
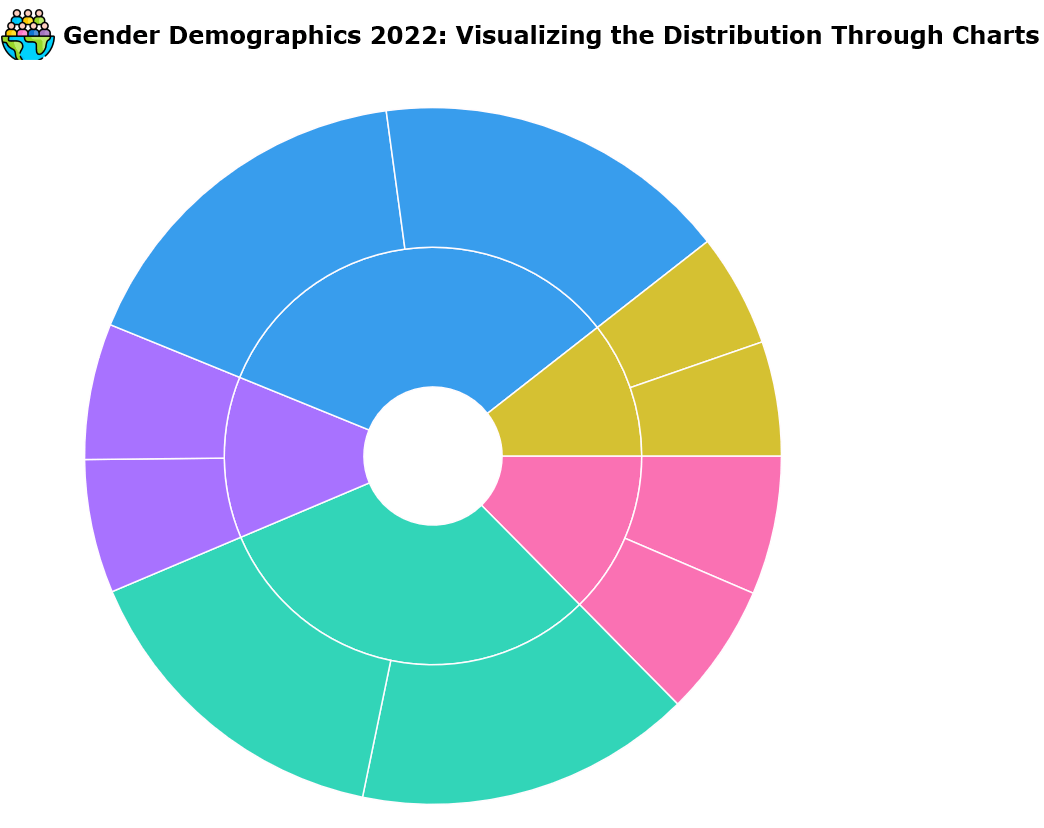
Titles
The Sunburst Chart control allows for the seamless integration of any MAUI view directly into the chart’s title. This capability enables you to provide additional context or supplementary information within the chart title.
This means you can enhance the chart’s title with dynamic views, adding layers of interactivity and information to your data visualization. Whether it’s additional text, images, or interactive elements, you can incorporate them directly into the title, making your charts more informative and engaging.
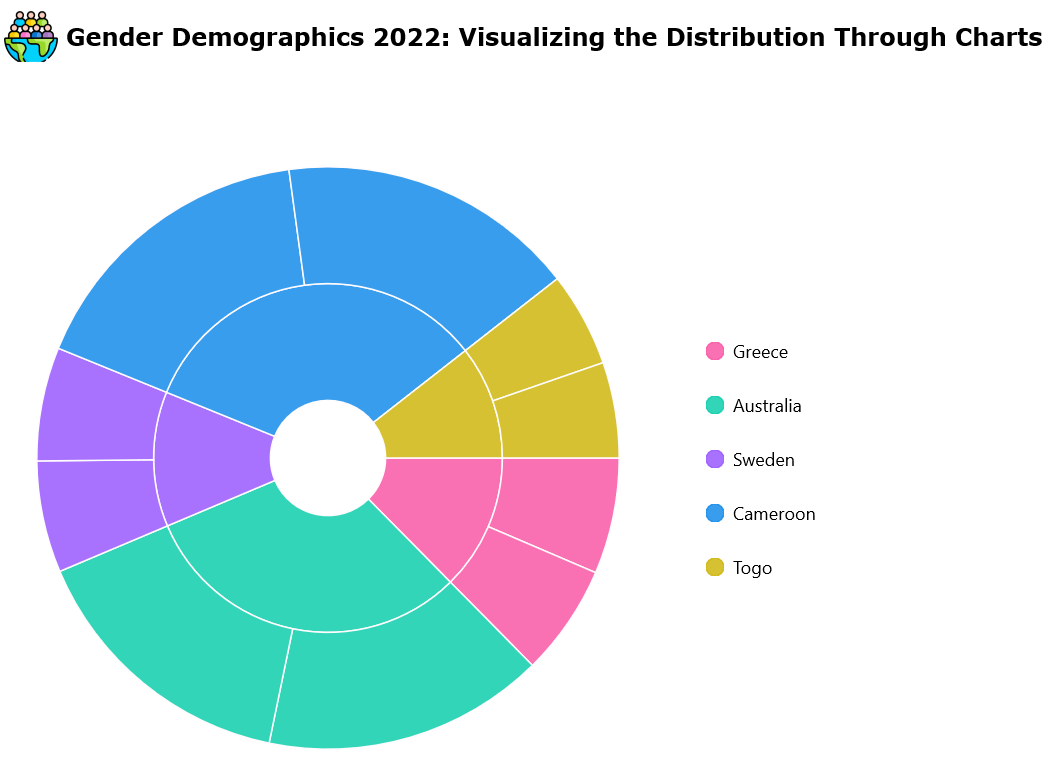
Legends
Elevate the readability and interpretability of the Sunburst Chart with the built-in legend support. The legend serves as an essential reference guide, assisting users in comprehending the various segments and their associated data points in the chart.
By providing a clear, concise guide to the qualities of the different segments, the legend makes the chart more accessible and user-friendly.
With it, users can quickly understand the data represented by each segment, making the chart not just a visualization but a comprehensive data exploration tool.
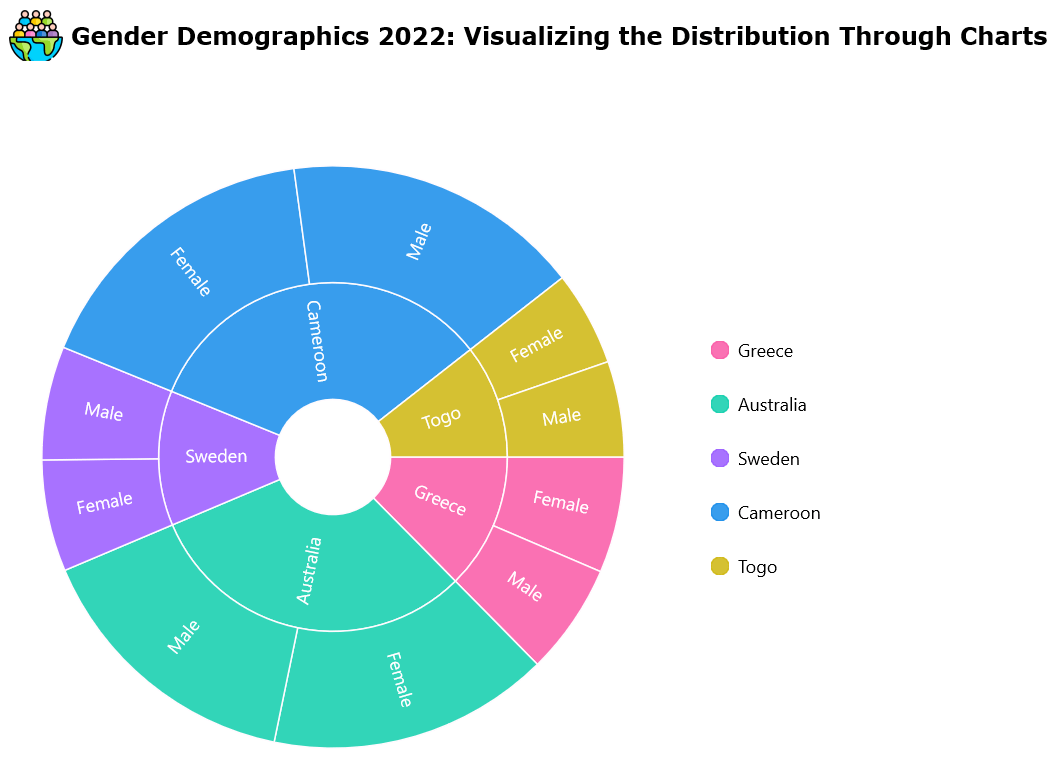
Data labels
Data labels are integral to the Sunburst Chart control, presenting detailed information about each segment. They ensure that the data represented in the chart is visually appealing, readable, and clear to the user.
However, the functionality of data labels extends beyond just presenting information. The Sunburst Chart control allows extensive customization options for these data labels. You can control their appearance, from the font style and size to the color and format. This will enable you to tailor the labels to match your chart’s aesthetics or highlight specific data points.
Moreover, you can also control the position of these labels for optimal readability. Whether you want them centered, closer to the edge, or at any specific point within the segment, the choice is yours.
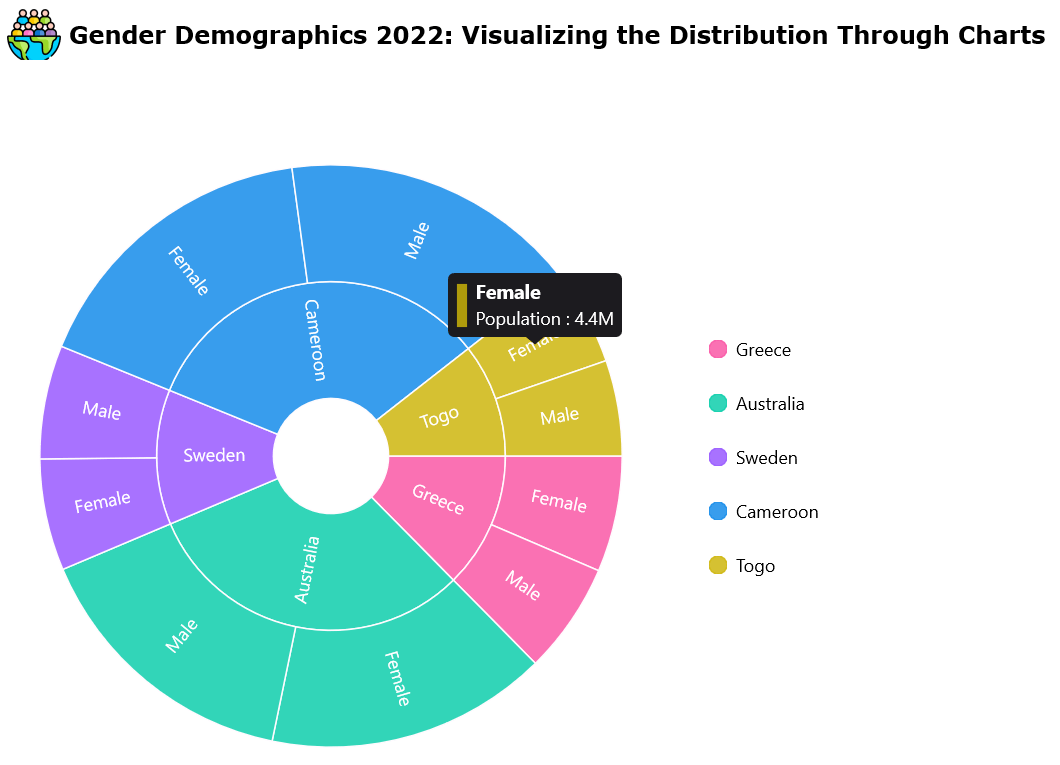
Tooltips
Tooltips are small informational boxes that appear when users hover the cursor over or interact with a segment in the chart. They provide immediate, context-specific details, enhancing the user’s understanding of the data.
You can customize the tooltips’ content, format, and appearance to align with your chart’s style or to highlight specific data points. This means you can control what information is displayed in the tooltips, how it’s presented, and how it looks, ensuring that users receive the exact information they need at the right moment.
Users can interact with your charts more effectively, gaining a deeper understanding of the data and making more informed decisions.
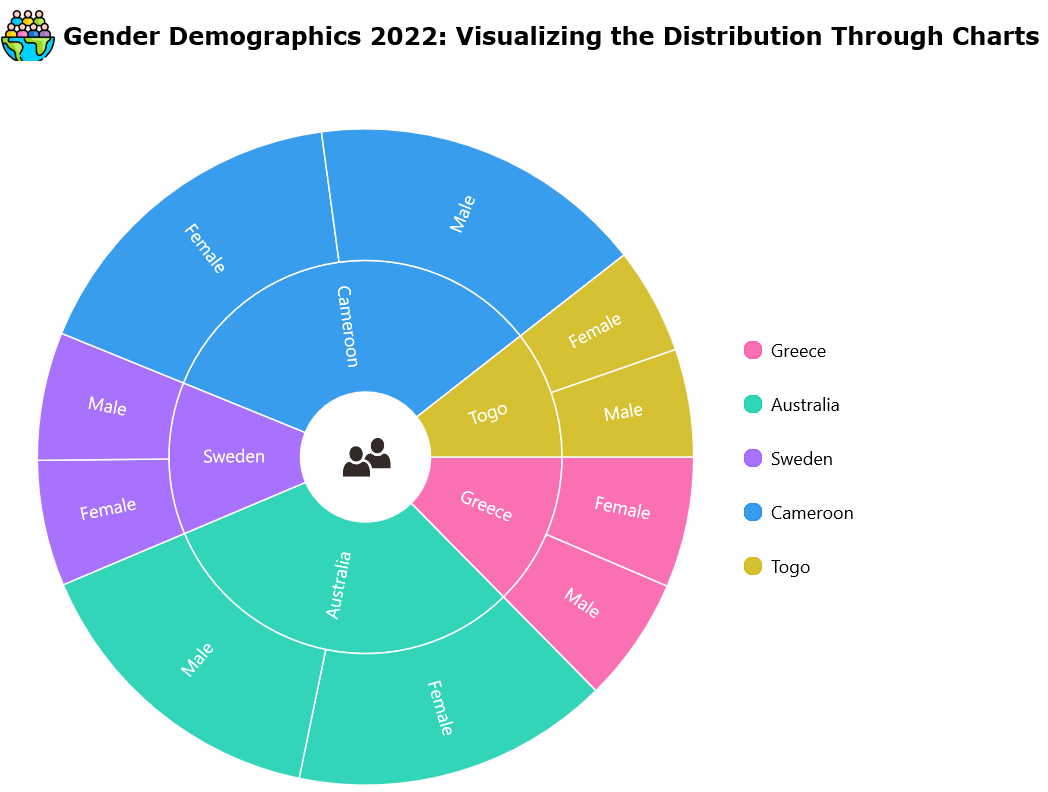
Center view
You can integrate any .NET MAUI view into the central hole of the Sunburst Chart. This opens up a world of possibilities for showcasing additional information or enhancing the visual appeal of your chart.
The center view is a dynamic canvas that can be customized to display additional data, incorporate interactive elements, or improve the aesthetic appeal of your chart.
By customizing this central space, you can enrich the overall user experience.
Getting started with the .NET MAUI Sunburst Chart control
We’ve explored the features of the Sunburst Chart. Let’s see the steps to integrate it into your .NET MAUI app.
Step 1: Create a .NET MAUI app
First, create a .NET MAUI application.
Step 2: Add the required NuGet package
Syncfusion .NET MAUI controls are available on the NuGet Gallery. To add the .NET MAUI Sunburst Chart control to your project, open the NuGet package manager in Visual Studio. Search for Syncfusion.Maui.SunburstChart and then install it.
Step 3: Register the handler
Next, register the handler for the Syncfusion core in the MauiProgram.cs file.
using Microsoft.Maui;
using Microsoft.Maui.Hosting;
using Microsoft.Maui.Controls.Compatibility;
using Microsoft.Maui.Controls.Hosting;
    using Microsoft.Maui.Controls.Xaml;
    using Syncfusion.Maui.Core.Hosting;

    namespace SunburstGettingStarted
    {
        public static class MauiProgram
        {
            public static MauiApp CreateMauiApp()
            {
                var builder = MauiApp.CreateBuilder();
                builder
                .UseMauiApp<App>()
                .ConfigureSyncfusionCore()
                .ConfigureFonts(fonts =>
                {
                    fonts.AddFont("OpenSans-Regular.ttf", "OpenSansRegular");
                });

                return builder.Build();
            }
        }
    }
Step 4: Add the namespace
Add the Syncfusion.Maui.SunburstChart namespace in your XAML page.
<ContentPage
 . . .
 xmlns:sunburst="clr-namespace:Syncfusion.Maui.SunburstChart;assembly=Syncfusion.Maui.SunburstChart">
 …
</ContentPage>
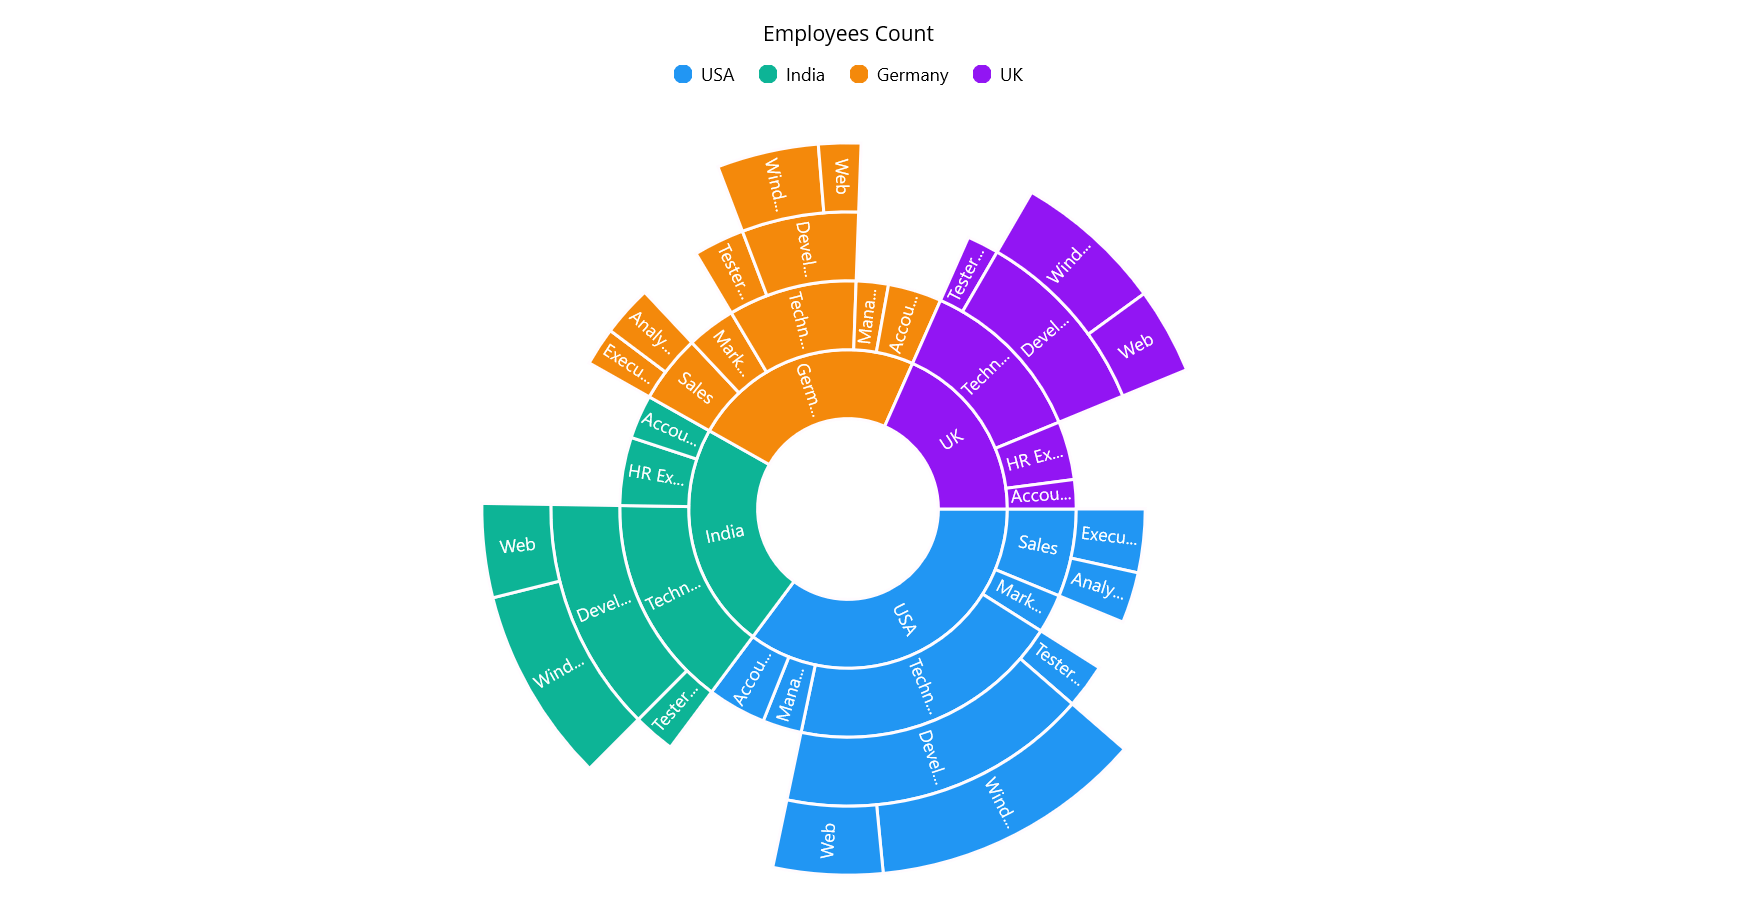
Step 5: Initialize the Syncfusion .NET MAUI Sunburst Chart control
Finally, initialize the Syncfusion .NET MAUI Sunburst Chart control. Refer to the following code example.
<ContentPage
 . . .
 xmlns:sunburst="clr-namespace:Syncfusion.Maui.SunburstChart;assembly=Syncfusion.Maui.SunburstChart"
 xmlns:model="clr-namespace:SunburstGettingStarted>

  <sunburst:SfSunburstChart x:Name="sunburst" ItemsSource="{Binding DataSource}" ValueMemberPath="EmployeesCount">

  . . .
  </sunburst:SfSunburstChart>
</ContentPage>
Refer to the following output image.
Note: For more details, refer to the .NET MAUI Sunburst Chart documentation.
GitHub references
Find the .NET MAUI Sunburst Chart control demo on GitHub.
Conclusion
Thanks for reading! We’ve journeyed together through the features of Syncfusion’s .NET MAUI Sunburst Chart control, a noteworthy addition to the Essential Studio® 2023 Volume 4 release.
For our esteemed customers, the new version of Essential Studio® is ready for download from the License and Downloads page. If you’re new to Syncfusion, we extend a warm invitation for you to take advantage of our 30-day free trial to explore our extensive range of features. We encourage you to experiment with these features and share your experiences and insights in the comments below.
For more information on this release, check out our Release Notes and What’s New pages.
If you have questions, you can contact us through our support forum, support portal, or feedback portal. We are always ready to assist you!
 No spam, just valuable updates.