
Welcome to our Chart of the Week blog series!
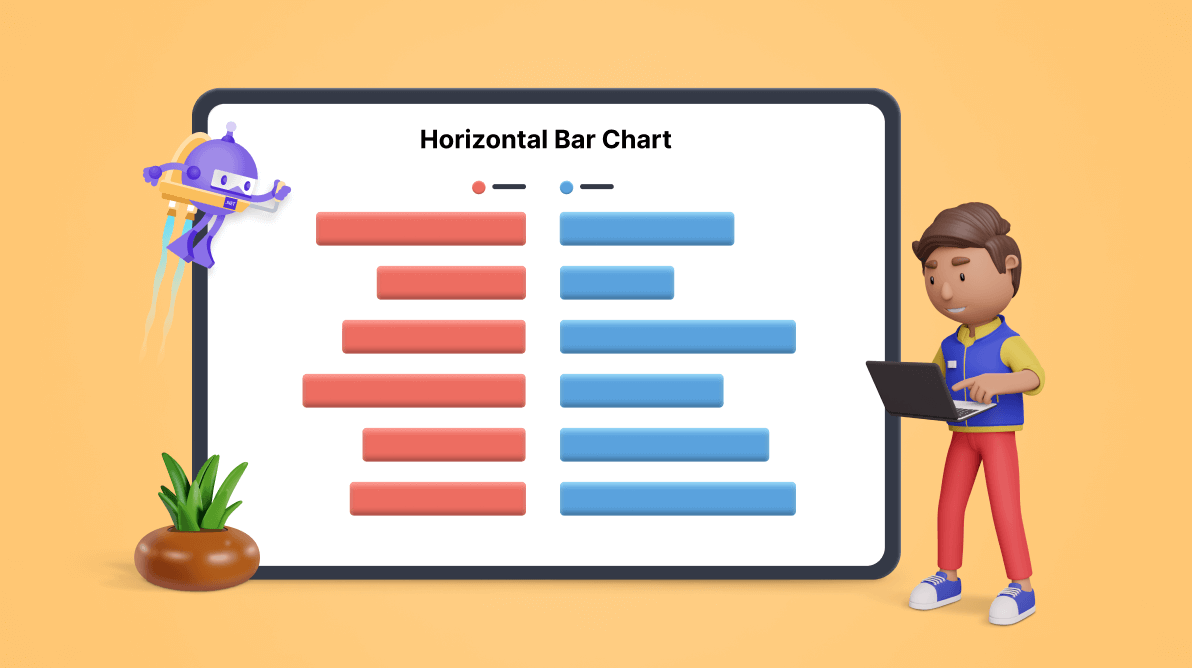
Today, we’ll create a horizontal bar chart to visualize the price comparison of groceries using the Syncfusion .NET MAUI Cartesian Charts control. This control is supported on both desktop (Windows and Mac) and mobile platforms (Android and iOS).
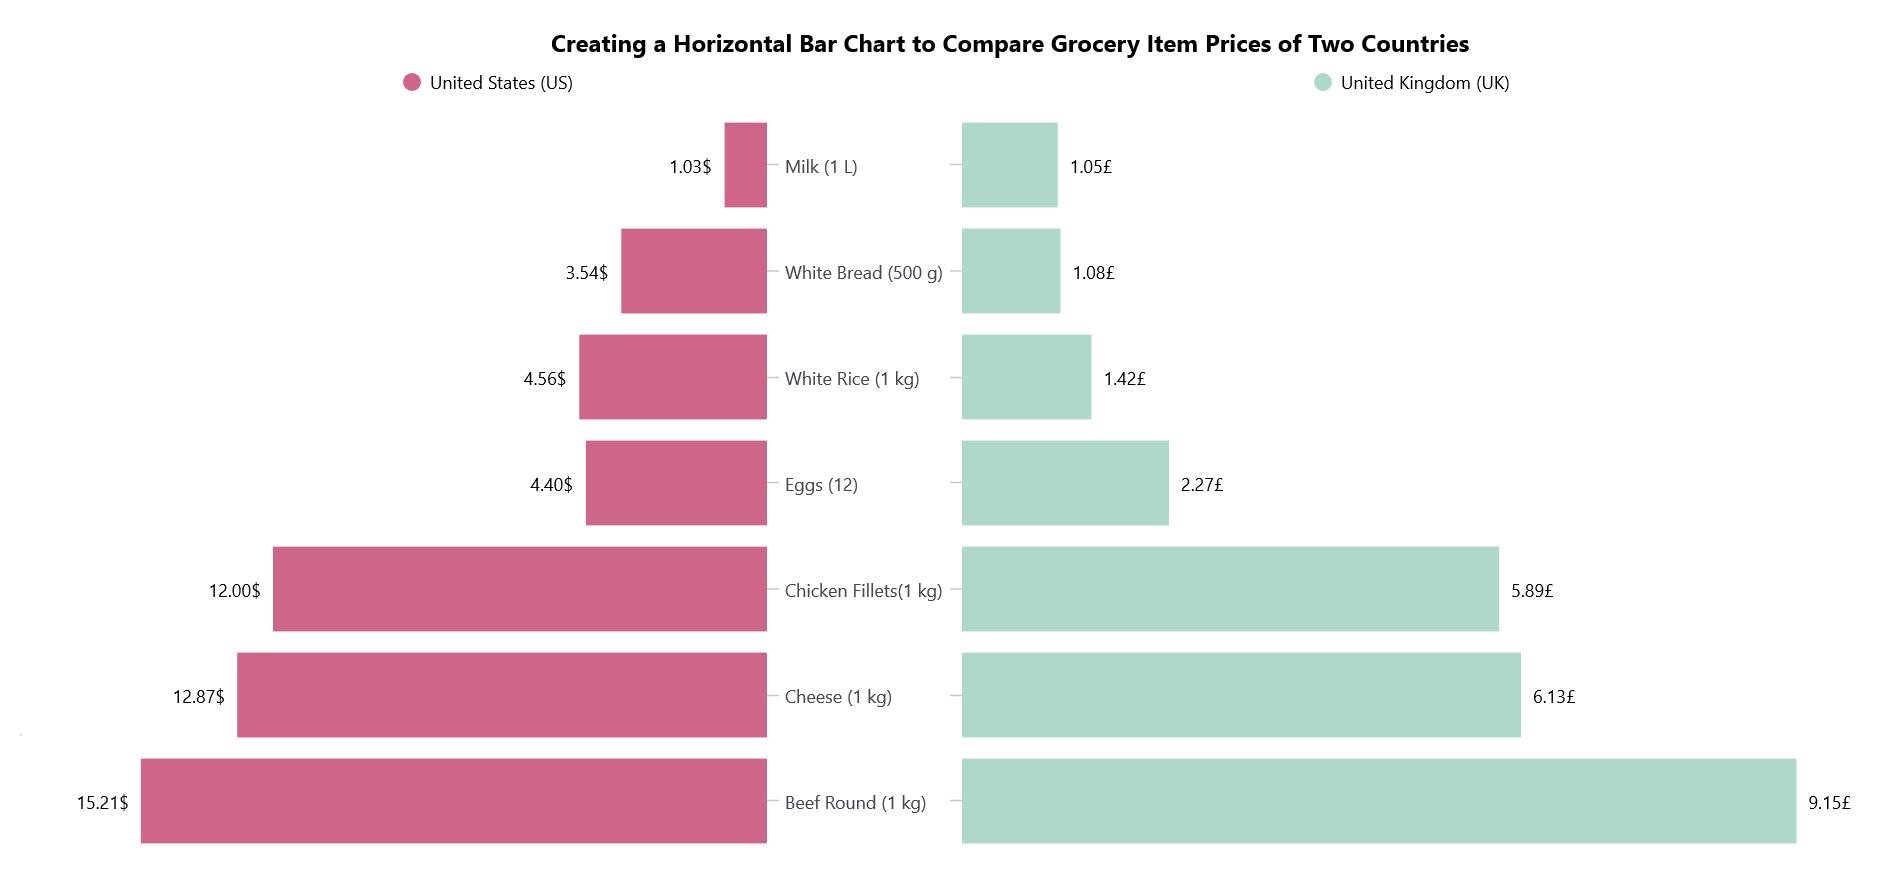
In this blog post, we’ll compare the prices of groceries in the United States and the United Kingdom using a horizontal bar chart that resembles a pyramid graph. It will allow us to identify and compare the prices of various grocery items easily.
Let’s get started!
Step 1: Collecting grocery price data
Before creating the chart, let’s gather data on grocery prices in the United States and the United Kingdom.
Step 2: Preparing data for the chart
Create a Model class that includes properties for storing information about grocery items and their prices in the United States and the United Kingdom.
Refer to the following code example.
public class Model
{
   public string GroceryItem { get; set; }
   public double USPrice { get; set; }
   public double UKPrice { get; set; }

}
Then, configure the ViewModel class to create a collection of grocery item price details and store it in an observable collection using the GroceryPriceDetails property.
Refer to the following code example.
public class ViewModel
{
   public ObservableCollection<Model> GroceryPriceDetails { get; set; }

   public ViewModel()
   {
      GroceryPriceDetails = new ObservableCollection<Model>();
      GroceryPriceDetails.Add(new Model() { GroceryItems = "Milk (1 L)", USPrice = 1.03, UKPrice = 1.05 });
      GroceryPriceDetails.Add(new Model() { GroceryItems = "White Bread (500 g)", USPrice = 3.54, UKPrice = 1.08 });
      GroceryPriceDetails.Add(new Model() { GroceryItems = "White Rice (1 kg)", USPrice = 4.56, UKPrice = 1.42 });
      GroceryPriceDetails.Add(new Model() { GroceryItems = "Eggs (12)", USPrice = 4.40, UKPrice = 2.27 });
      GroceryPriceDetails.Add(new Model() { GroceryItems = "Chicken Fillets(1 kg)", USPrice = 12.00, UKPrice = 5.89 }); ;
      GroceryPriceDetails.Add(new Model() { GroceryItems = "Cheese (1 kg)", USPrice = 12.87, UKPrice = 6.13 });
      GroceryPriceDetails.Add(new Model() { GroceryItems = "Beef Round (1 kg)", USPrice = 15.21, UKPrice = 9.15 });

    }
 }
Step 3: Layout definition
Define the layout using a Border element. Inside the border, we utilize a Grid to place our content.
Refer to the following code example.
<Border StrokeShape="RoundRectangle 20"
         StrokeThickness="4"
         Stroke="Gray"
         Margin="20">
 <Grid ColumnSpacing="0">
  <Grid.ColumnDefinitions>
   <ColumnDefinition Width="*"/>
   <ColumnDefinition Width="*"/>
  </Grid.ColumnDefinitions>

  <Grid.RowDefinitions>
   <RowDefinition Height="*"/>
  </Grid.RowDefinitions>
 </Grid>
</Border>
Step 4: Configuring the Syncfusion .NET MAUI Cartesian Charts
Let’s configure the Syncfusion .NET MAUI Cartesian Charts control using this documentation.
Refer to the following code example.
<Grid >

 <!--US Chart -->
 <chart:SfCartesianChart Grid.Row="1" Grid.Column="0">
  <chart:SfCartesianChart.XAxes>
   <Chart:CategoryAxis />
  </chart:SfCartesianChart.XAxes>

  <chart:SfCartesianChart.YAxes>
   <Chart:NumericalAxis />
  </chart:SfCartesianChart.YAxes>
 </chart:SfCartesianChart>

 <!--UK Chart -->
 <chart:SfCartesianChart Grid.Column="1" Grid.Row="1">
  <chart:SfCartesianChart.XAxes>
   <Chart:CategoryAxis />
  </chart:SfCartesianChart.XAxes>

  <chart:SfCartesianChart.YAxes>
   <Chart:NumericalAxis />
  </chart:SfCartesianChart.YAxes>
 </chart:SfCartesianChart>

</Grid>
Now that we’ve configured the Syncfusion .NET MAUI Cartesian Charts control, let’s see how to create a horizontal bar chart that resembles a pyramid with it!
Step 5: Initialize the horizontal bar chart
To compare the grocery item prices, we’ll use the ColumnSeries instance and set the IsTransposed property to true to initialize the horizontal bar chart.
<!--US Grocery Items Price Chart -->
<chart:SfCartesianChart IsTransposed="True" >
 ..
 <Chart:ColumnSeries />
</chart:SfCartesianChart>

<!--UK Grocery Items Price Chart -->
<chart:SfCartesianChart IsTransposed="True" >
 …
 <Chart:ColumnSeries />
</chart:SfCartesianChart>
Step 6: Binding data to the bar chart
This step involves using the ColumnSeries instance to bind the grocery items’ price data.
Refer to the following code example.
<!--US Grocery Items Price Chart -->
<chart:SfCartesianChart IsTransposed="True" >
 …
 <chart:ColumnSeries ItemsSource="{Binding GroceryPriceDetails}"
                     XBindingPath="GroceryItems"
                     YBindingPath="USPrice" />
</chart:SfCartesianChart>

<!--UK Grocery Items Price Chart -->
<chart:SfCartesianChart IsTransposed="True" >
 …
 <chart:ColumnSeries ItemsSource="{Binding GroceryPriceDetails}"
                     XBindingPath="GroceryItems"
                     YBindingPath="UKPrice"/>
</chart:SfCartesianChart>
In the previous code, we’ve bound the ItemSource property with the GroceryPriceDetails property. The XBindingPath is bound with the grocery items count, and the YBindingPath is bound with the price details.
Step 7: Initializing the legend
A legend displays information corresponding to the chart series. Let’s implement a legend in our bar chart, as shown in the following code example.
<chart:SfCartesianChart.Legend>
 <Chart:ChartLegend/>
</chart:SfCartesianChart.Legend>
Step 8: Customizing the chart appearance
We can customize the appearance of the horizontal bar chart using various properties and styles.
Customizing the title
Refer to the following code example, which customizes the chart title using the Label property. In it, we’ve defined the title’s Text, FontSize, FontAttributes, and other properties.
<Label Grid.Row="0"
       Grid.ColumnSpan="2"
       Text="Creating a Horizontal Bar Chart to Compare Grocery Item Prices of Two Countries"
       TextColor="Black"
       FontSize="16"
       FontFamily="TimeSpan"
       FontAttributes="Bold"
       HorizontalOptions="Start"
       Padding="350,5,0,0"/>
Customizing the axes
Let’s customize the x- and y-axes using properties such as LabelStyle, AxisLineStyle, and MajorTickStyle.
<!--US Chart Axis Customization -->
 <chart:SfCartesianChart.XAxes>
  <chart:CategoryAxis IsInversed="True"
                      ShowMajorGridLines="False"
                      LabelCreated="CategoryAxis_LabelCreated">
   <Chart:CategoryAxis.LabelStyle>
    <chart:ChartAxisLabelStyle TextColor="#49454F"
                               FontSize="12"
                               LabelAlignment="Center"/>
   </Chart:CategoryAxis.LabelStyle>
   <Chart:CategoryAxis.AxisLineStyle>
    <chart:ChartLineStyle StrokeWidth ="0"/>
   </Chart:CategoryAxis.AxisLineStyle>
   <Chart:CategoryAxis.MajorTickStyle>
    <chart:ChartAxisTickStyle Stroke="#C5C8CE"/>
   </Chart:CategoryAxis.MajorTickStyle>
  </Chart:CategoryAxis>
 </chart:SfCartesianChart.XAxes>

 <chart:SfCartesianChart.YAxes>
  <chart:NumericalAxis IsInversed="True"
                       ShowMajorGridLines="False"
                       Maximum="18"
                       IsVisible="False">
  </Chart:NumericalAxis>
 </chart:SfCartesianChart.YAxes>

<!--UK Chart Axis Customization -->
 <chart:SfCartesianChart.XAxes>
  <chart:CategoryAxis ShowMajorGridLines="False"
                      IsInversed="True">
   <Chart:CategoryAxis.LabelStyle>
    <chart:ChartAxisLabelStyle TextColor="Transparent"
                               FontSize="1"
                               Margin="-5"/>
   </Chart:CategoryAxis.LabelStyle>
   <Chart:CategoryAxis.AxisLineStyle>
    <chart:ChartLineStyle StrokeWidth ="0"/>
   </Chart:CategoryAxis.AxisLineStyle>
   <Chart:CategoryAxis.MajorTickStyle>
    <chart:ChartAxisTickStyle Stroke="#C5C8CE"/>
   </Chart:CategoryAxis.MajorTickStyle>
  </Chart:CategoryAxis>
 </chart:SfCartesianChart.XAxes>

 <chart:SfCartesianChart.YAxes>
  <chart:NumericalAxis IsVisible="False"
                       ShowMajorGridLines="False"
                       Maximum="10">
  </Chart:NumericalAxis>
 </chart:SfCartesianChart.YAxes>
Customizing the series data labels
Add the chart’s data label and customize the label formats as shown in the following code example.
<!--US Chart Axis Customization -->
<chart:ColumnSeries ShowDataLabels="True"
                    Label="United States (US)">
 <Chart:ColumnSeries.DataLabelSettings>
  <chart:CartesianDataLabelSettings LabelPlacement="Outer">
   <chart:CartesianDataLabelSettings.LabelStyle>
    <chart:ChartDataLabelStyle LabelFormat="0.00'$" Background="White"/>
   </chart:CartesianDataLabelSettings.LabelStyle>
  </chart:CartesianDataLabelSettings>
 </Chart:ColumnSeries.DataLabelSettings>
</Chart:ColumnSeries>

<!--UK Chart Axis Customization -->
<chart:ColumnSeries ShowDataLabels="True"
                    Label="United Kingdom (UK)">
 <Chart:ColumnSeries.DataLabelSettings>
  <chart:CartesianDataLabelSettings LabelPlacement="Outer">
   <chart:CartesianDataLabelSettings.LabelStyle>
    <chart:ChartDataLabelStyle LabelForm”t="0.00’£" Background="White"/>
   </chart:CartesianDataLabelSettings.LabelStyle>
  </chart:CartesianDataLabelSettings>
 </Chart:ColumnSeries.DataLabelSettings>
</Chart:ColumnSeries>
Customizing the series appearance
We also apply the color for each series using the Fill property. Refer to the following example.
<!--US Series-->
<chart:ColumnSeries Fill="#CD6688">
</Chart:ColumnSeries>

<!--UK Series-->
<chart:ColumnSeries Fill="#AED8CC">
</Chart:ColumnSeries>
After executing the previous code examples, our output will look like the following image.
GitHub reference
For more information, refer to the project on GitHub.
Conclusion
Thanks for reading! This blog showed how to create a horizontal bar chart using the Syncfusion .NET MAUI Cartesian Charts control to visualize a price comparison of grocery items in the United States and the United Kingdom. We encourage you to follow the steps provided and share your thoughts on the experience in the comment section below.
You can contact us through our support forum, support portal, or feedback portal. We are always happy to assist you!


 No spam, just valuable updates.