The Essential Studio 2023 Volume 4 release gives Syncfusion’s .NET MAUI Charts innovative new types and features that enhance data visualization and redefine user interaction.
In this blog, we’ll go over these features, accompanied by practical code examples that bring them to life.
Note: We’ve got your back if you’re beginning your journey with .NET MAUI Charts! Our comprehensive getting started guide is the best resource for your first step into using these controls.
New chart types in Cartesian Charts
The .NET MAUI Cartesian Charts control has been enriched with two new chart types designed to enhance your data visualization experience.
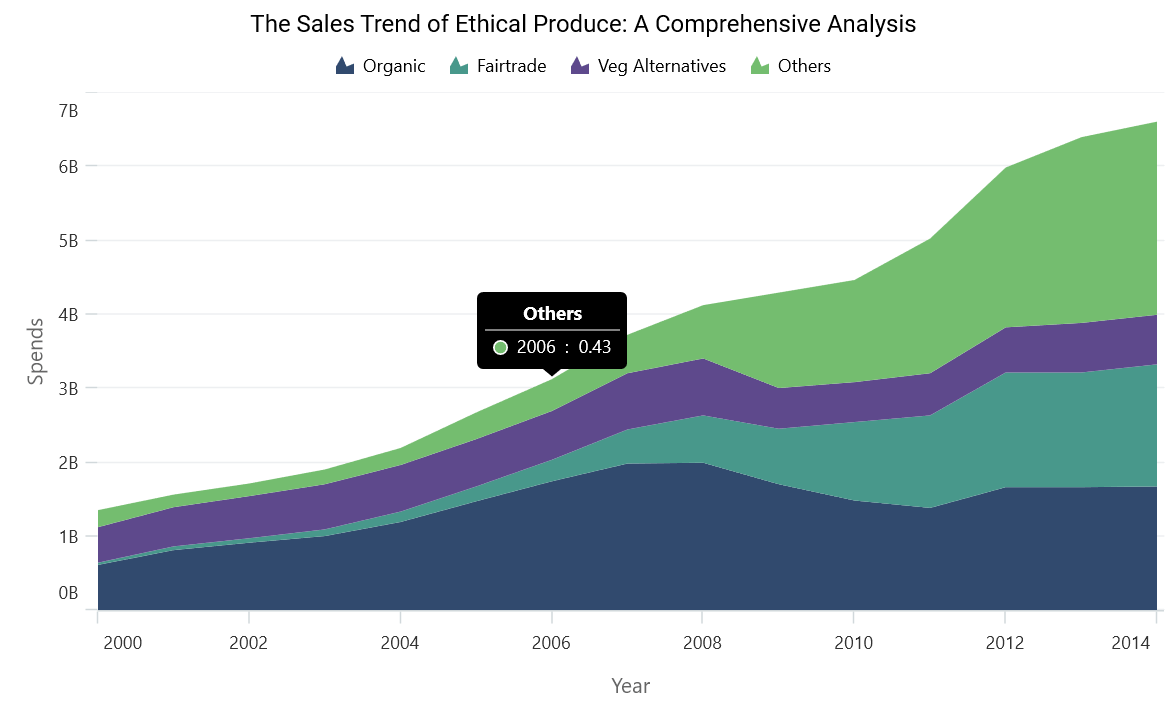
Stacked area chart
The stacked area chart type allows you to visualize data points as areas stacked atop one another. It offers a holistic view of cumulative values. Use it to highlight trends and compare the contributions of individual elements to the overall picture.
Refer to the following code example.
<chart:SfCartesianChart>

 <chart:SfCartesianChart.XAxes>
  <chart:CategoryAxis/>
 </chart:SfCartesianChart.XAxes>

 <chart:SfCartesianChart.YAxes>
  <chart:NumericalAxis/>
 </chart:SfCartesianChart.YAxes>

 <chart:StackingAreaSeries ItemsSource="{Binding Data1}"
                           XBindingPath="Year"
                           YBindingPath="Value"
 </chart:StackingAreaSeries>

 <chart:StackingAreaSeries ItemsSource="{Binding Data2}"
                           XBindingPath="Year"
                           YBindingPath="Value"
 </chart:StackingAreaSeries>

 <chart:StackingAreaSeries ItemsSource="{Binding Data3}"
                           XBindingPath="Year"
                           YBindingPath="Value"
 </chart:StackingAreaSeries>

 <chart:StackingAreaSeries ItemsSource="{Binding Data4}"
                           XBindingPath="Year"
                           YBindingPath="Value"
 </chart:StackingAreaSeries>

</chart:SfCartesianChart>
Refer to the following image.
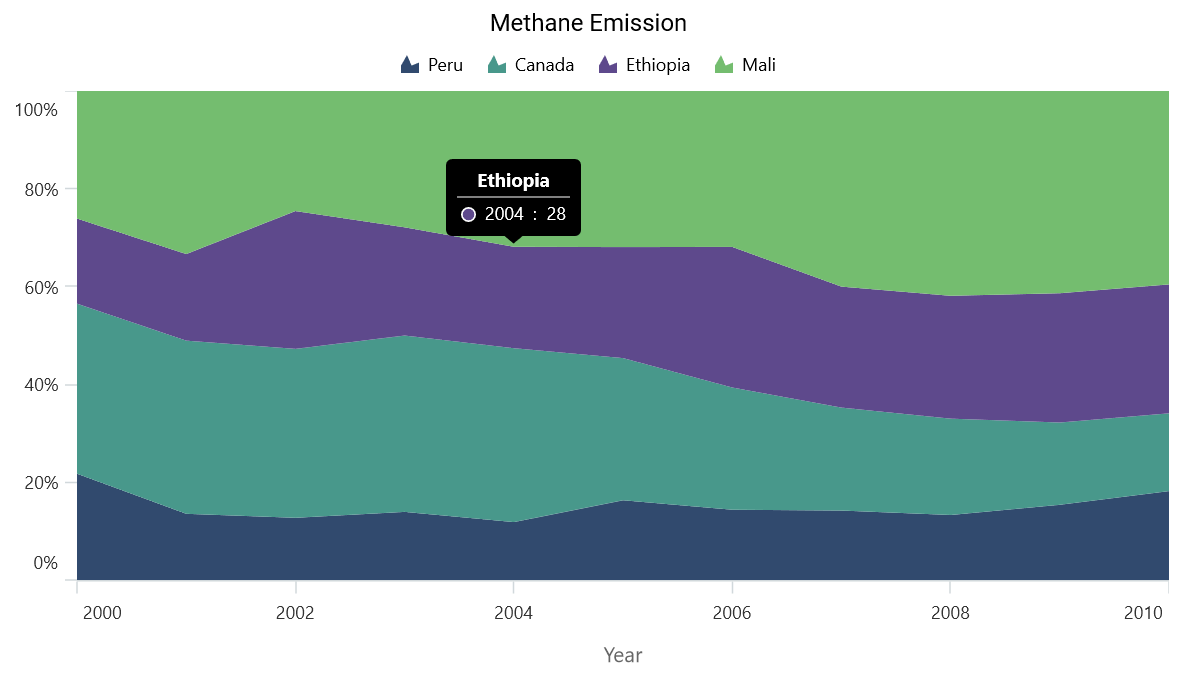
100% stacked area chart
Similar to the stacked area chart, this new series type presents the cumulative portion of each stacked element, but it always adds up to 100%. This allows for a deeper understanding of the proportional distribution of values within the stacked areas.
With the 100% stacked area chart, you can gain valuable insights into the relative contribution of each element to a whole.
<chart:SfCartesianChart>

 <chart:SfCartesianChart.XAxes>
  <chart:CategoryAxis/>
 </chart:SfCartesianChart.XAxes>

 <chart:SfCartesianChart.YAxes>
  <chart:NumericalAxis/>
 </chart:SfCartesianChart.YAxes>

 <chart:StackingArea100Series ItemsSource="{Binding Data1}"
                              XBindingPath="Year"
                              YBindingPath="Value"
 </chart:StackingArea100Series>

 <chart:StackingArea100Series ItemsSource="{Binding Data2}"
                              XBindingPath="Year"
                              YBindingPath="Value"
 </chart:StackingArea100Series>

 <chart:StackingArea100Series ItemsSource="{Binding Data3}"
                              XBindingPath="Year"
                              YBindingPath="Value"
 </chart:StackingArea100Series>

 <chart:StackingArea100Series ItemsSource="{Binding Data4}"
                              XBindingPath="Year"
                              YBindingPath="Value"
    </chart:StackingArea100Series>

</chart:SfCartesianChart>
Refer to the following image.
Trackball label created event
Step up your user interaction with the new TrackballLabelCreated event. This event springs into action as the trackball glides between data points, enabling users to get more information via the current TrackballPointInfo property. It’s not just about viewing data anymore; it’s about interacting with it and extracting value from every movement.
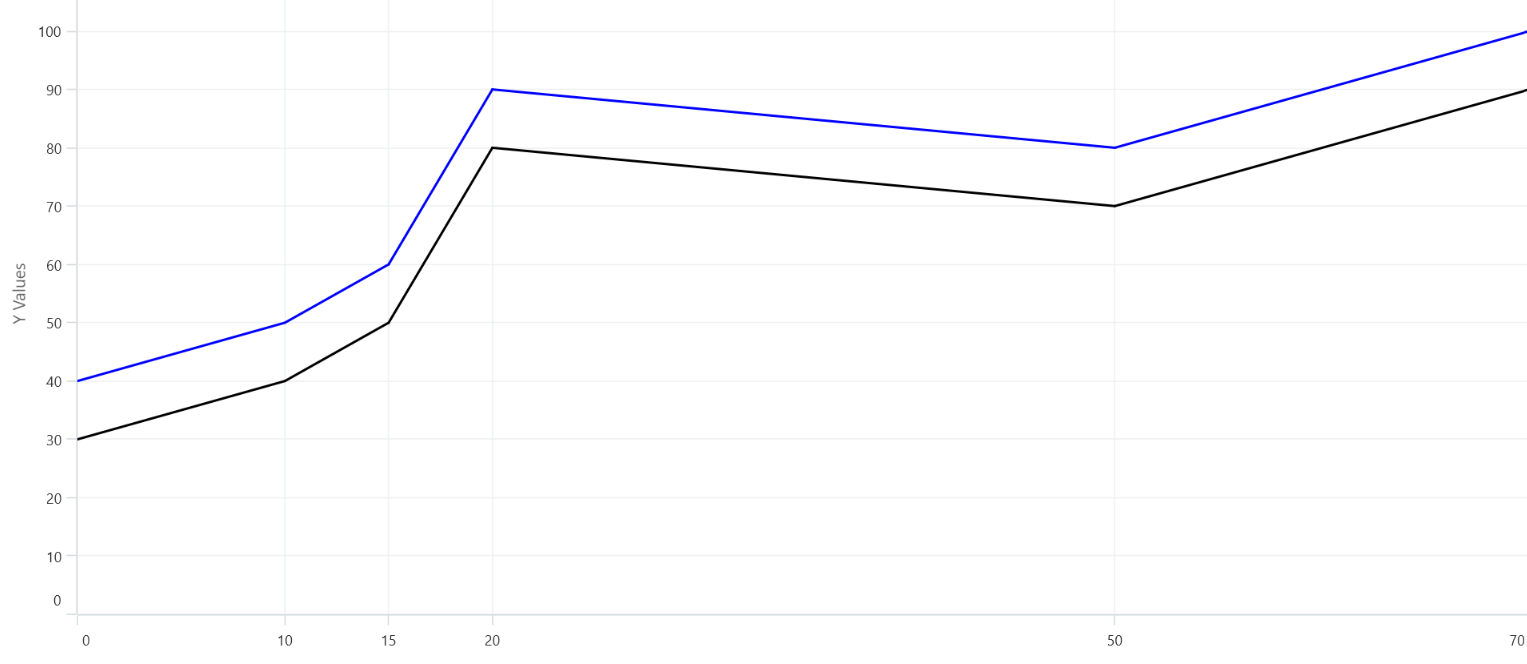
Customizing visible labels and range
Take control of axis labels with the ability to retrieve and modify the visible labels collection. Additionally, users can access the visible range of the axis in real-time using the VisibleMinimum and VisibleMaximum properties. Thus, the precision of data interpretation is enhanced.
Let’s consider the use case of creating a nonlinear number series in a numerical axis, which can be achieved in the following code.
public class CustomNumericalAxis : NumericalAxis
{
     //Consider adding this axis to the chart.
     //CustomNumericalAxis primaryAxis = new CustomNumericalAxis();
     //chart.XAxes.Add(primaryAxis);


     protected override void OnCreateLabels()
     {
          base.OnCreateLabels();

          if (VisibleLabels != null)
          {
                VisibleLabels.Clear(); // Clear existing labels

	        var Items = new int[] { 0, 10, 15, 20, 50, 70 };

	        foreach(var item in Items )
	        {
	            if(item >= VisibleMinimum && item <= VisibleMaximum)
                    {
                        VisibleLabels.Add(new ChartAxisLabel(item, item.ToString()));
                    }
               }
          }
     }
}
Refer to the following image.
Conclusion
Thanks for reading this blog about the exciting new chart types and features added in Syncfusion’s .NET MAUI Charts controls as part of the 2023 Volume 4 release. These enhancements are designed to elevate the readability and interpretation of your chart data, providing a more insightful and engaging user experience.
Don’t forget to explore our Release Notes and What’s New pages to see all the other enhancements and additions to Essential Studio in the 2023 Volume 4 release.
For our current customers, the new version is available for download from the License and Downloads page. If you’re new to Syncfusion, we invite you to take advantage of our 30-day free trial to explore our wide range of features.
We’re here to support you every step of the way. Feel free to contact us through our support forum, support portal, or feedback portal. We’re always eager to assist you!