
Welcome to our Chart of the Week blog series!
Today, we’ll examine how US tech companies tend to utilize the dual-class voting structure more frequently than non-tech companies using the Syncfusion .NET MAUI Area Chart control.
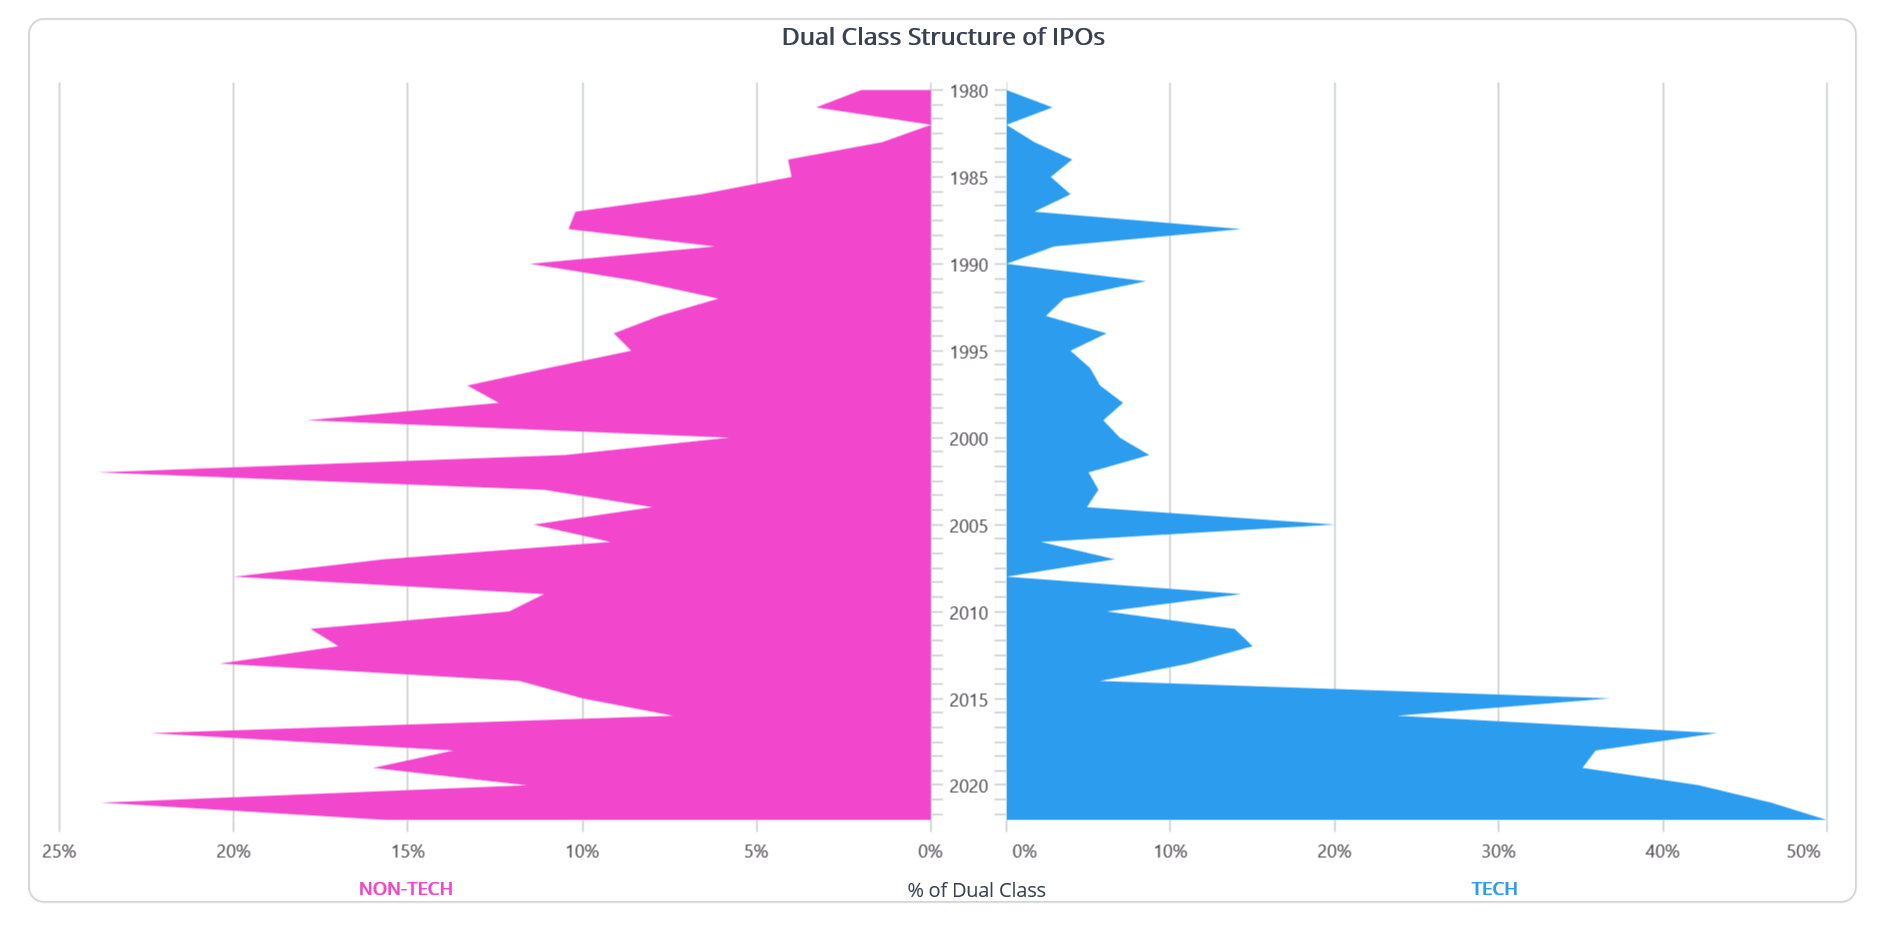
Many corporations are adopting a dual-class voting structure for their initial public offerings (IPOs). The reason for adopting this structure is to allow founders and key stakeholders to retain control over strategic decision-making. By giving themselves shares that allow multiple votes per share, they can maintain significant influence on the direction of the company.
The following image shows the growth of dual-class structures in IPOs in tech and non-tech US companies since 1980.
In this blog, we’ll go through the steps to create multiple area charts that compare dual-class voting structures among US tech and non-tech companies.
Step 1: Gathering the data
Before proceeding, we need to obtain the data for the percentage of dual-class voting structures in companies from 1980 to 2022. The University of Florida provides this data. Save it in a CSV file.
Step 2: Populating the data for the chart
Let’s create a DualVotingModel class with the following properties:
- Year: This property contains the year details from 1980 to 2022.
- TechPercentage: This property holds the percentage of dual-class voting tech companies in a specific year.
- NonTechPercentage: This property holds the percentage of dual-class voting non-tech companies in a specific year.
Refer to the following code example.
public class DualVotingModel
 {
    public int Year { get; set; }
    public double TechPercentage { get; set; }
    public double NonTechPercentage { get; set; }

   public DualVotingModel(int year, double techPercentage, double nonTechPercentage)
   {
      Year = year;
      TechPercentage = techPercentage;
      NonTechPercentage = nonTechPercentage;
   }
 }
Now, generate the collection of voting percentage details using the DualClassVotingPercentage class and its VotingPercentage property. Load the CSV data into the dual-class voting data collection using the ReadCSV method and save it in the VotingPercentage property.
public class DualClassVotingPercentage
 {
   public List<DualVotingModel> VotingPercentage { get; set; }

   public DualClassVotingPercentage()
   {
      VotingPercentage = new List<DualVotingModel>(ReadCSV());
   }

   public IEnumerable<DualVotingModel> ReadCSV()
   {
       Assembly executingAssembly = typeof(App).GetTypeInfo().Assembly;
       Stream inputStream = executingAssembly.GetManifestResourceStream("DualClassVoting.Resources.Raw.dualclassvoting.csv");

       string line;
       List<string> lines = new List<string>();

       using StreamReader reader = new StreamReader(inputStream);
       while ((line = reader.ReadLine()) != null)
       {
           lines.Add(line);
       }

       return lines.Select(line =>
       {
          string[] data = line.Split(',');
          return new DualVotingModel(Convert.ToInt32(data[0]), Convert.ToDouble(data[1]),Convert.ToDouble(data[2]));
       });
   }
 }
Step 3: Defining the grid
To create multiple area charts with the desired view, a grid definition should be assigned in your .NET MAUI project.
Refer to the following code example.
<Grid>
 <Grid.ColumnDefinitions>
  <ColumnDefinition Width="*"/>
  <ColumnDefinition Width="*"/>
 </Grid.ColumnDefinitions>

 <Grid.RowDefinitions>
  <RowDefinition Height="Auto"/>
  <RowDefinition Height="*"/>
  <RowDefinition Height="Auto"/>
 </Grid.RowDefinitions>
</Grid>
Step 4: Configuring the Syncfusion .NET MAUI Cartesian Charts
Let’s configure the Syncfusion .NET MAUI Cartesian Charts control using this documentation.
<Grid>

 <!--Chart 1 -->

  <chart:SfCartesianChart Grid.Row="1" Grid.Column="0">
   <chart:SfCartesianChart.XAxes>
    <chart:NumericalAxis/>
   </chart:SfCartesianChart.XAxes>
   <chart:SfCartesianChart.YAxes>
    <chart:NumericalAxis/>
   </chart:SfCartesianChart.YAxes>
  </chart:SfCartesianChart>

 <!--Chart 2 -->

  <chart:SfCartesianChart Grid.Row="1" Grid.Column="1">
   <chart:SfCartesianChart.XAxes>
    <chart:NumericalAxis/>
   </chart:SfCartesianChart.XAxes>
   <chart:SfCartesianChart.YAxes>
    <chart:NumericalAxis/>
   </chart:SfCartesianChart.YAxes>
  </chart:SfCartesianChart>

</Grid>
Step 5: Binding data to the area charts
Use Syncfusion’s AreaSeries instance to bind the data for US tech and non-tech companies adopting dual-class voting structures.
Refer to the following code example.
<!--Chart 1 -->

<chart:AreaSeries ItemsSource="{Binding VotingPercentage}"
                  XBindingPath="Year"
                  YBindingPath="NonTechPercentage"/>

<!--Chart 2 -->

<chart:AreaSeries ItemsSource="{Binding VotingPercentage}"
                  XBindingPath="Year"
                  YBindingPath="TechPercentage"/>
In the previous example, we’ve created two area charts to display the dual-class voting percentages of non-tech and tech companies over a period of time. The data required for these charts is supplied through the VotingPercentage property, which provides a collection of objects with properties such as Year, NonTechPercentage, and TechPercentage.
Step 6: Customizing the chart appearance
We can improve the appearance of the .NET MAUI Area Chart by customizing the axis elements, title area color, and more.
Customizing the chart title
The chart title has been customized to describe the dual-class voting structure data visualized in the chart. The following code example illustrates how to provide a common title for both charts.
<Grid>
 <Label Grid.Row="0" Grid.ColumnSpan="2" Text="Dual Class Structure of IPOs" TextColor="#374151" FontSize="16" HorizontalOptions="Center"/>
 <AbsoluteLayout Grid.Row="2" Grid.ColumnSpan="2" Margin="0,5,0,0">
  <Label Text="NON-TECH" TextColor="#F247CC" FontSize="12" FontAttributes="Bold" AbsoluteLayout.LayoutFlags="PositionProportional" AbsoluteLayout.LayoutBounds="0.19,0.2,-1,-1"/>
  <Label Text="% of Dual Class" TextColor="#374151" FontSize="13" AbsoluteLayout.LayoutFlags="PositionProportional" AbsoluteLayout.LayoutBounds="0.52,0.2,-1,-1"/>
  <Label Text="TECH" TextColor="#2C9CEE" FontSize="12" FontAttributes="Bold"  AbsoluteLayout.LayoutFlags="PositionProportional" AbsoluteLayout.LayoutBounds="0.81,0.2,-1,-1"/>
 </AbsoluteLayout>
</Grid>
Chart positioning
Positioning the chart is crucial to achieve the desired visual impact and organize the user interface. In this case, we have transposed the chart using the IsTransposed property, which swaps the x- and y-axes.
<!--Chart 1 -->

 <chart:SfCartesianChart  IsTransposed="True"
 </chart:SfCartesianChart>

<!--Chart 2 -->

 <chart:SfCartesianChart  IsTransposed="True">
 </chart:SfCartesianChart>
Axis customization
We can position and customize the chart axis according to our needs using the axis elements.
The following code example demonstrates how to position the y-axis and show common x-axis labels for both charts.
<!--Chart 1 -->

<chart:SfCartesianChart.XAxes>
  <chart:NumericalAxis IsInversed="True" Interval="{OnPlatform Android=10,iOS=10,Default=5}" ShowMajorGridLines="False" PlotOffsetEnd="5" MinorTicksPerInterval="5" ShowMinorGridLines="False">
  <chart:NumericalAxis.LabelStyle>
   <chart:ChartAxisLabelStyle TextColor="Transparent" FontSize="1" Margin="0,0,-5,0"/>
  </chart:NumericalAxis.LabelStyle>
</chart:SfCartesianChart.XAxes>

<chart:SfCartesianChart.YAxes>
  <chart:NumericalAxis IsInversed="True" CrossesAt="{Static x:Double.MaxValue}"
        PlotOffsetStart="20" Interval="5">
   <chart:NumericalAxis.LabelStyle>
    <chart:ChartAxisLabelStyle LabelFormat="0'%" TextColor="#49454F" FontSize="12"/>
   </chart:NumericalAxis.LabelStyle>
  </chart:NumericalAxis>
</chart:SfCartesianChart.YAxes>

<!--Chart 2 -->

<chart:SfCartesianChart.XAxes>
  <chart:NumericalAxis IsInversed="True" Interval="{OnPlatform Android=10,iOS=10,Default=5}" PlotOffsetEnd="5" ShowMajorGridLines="False" MinorTicksPerInterval="5" ShowMinorGridLines="False">
   <chart:NumericalAxis.LabelStyle>
    <chart:ChartAxisLabelStyle TextColor="#49454F" FontSize="12"/>
   </chart:NumericalAxis.LabelStyle>
  </chart:NumericalAxis>
</chart:SfCartesianChart.XAxes>

<chart:SfCartesianChart.YAxes>
  <chart:NumericalAxis CrossesAt="{Static x:Double.MaxValue}" PlotOffsetEnd="20"
    Interval="10">
  <chart:NumericalAxis.LabelStyle>
   <chart:ChartAxisLabelStyle LabelFormat="0'%" TextColor="#49454F" FontSize="12"/>
  </chart:NumericalAxis>
</chart:SfCartesianChart.YAxes>
We can also customize the line style, tick line style, and label style of axis elements as shown in the following code example.
<chart:NumericalAxis>
 <chart:NumericalAxis.AxisLineStyle>
  <chart:ChartLineStyle StrokeWidth ="0"/>
 </chart:NumericalAxis.AxisLineStyle>
 <chart:NumericalAxis.MajorGridLineStyle>
  <chart:ChartLineStyle Stroke="#b0b3b8"/>
 </chart:NumericalAxis.MajorGridLineStyle>
 <chart:NumericalAxis.MajorTickStyle>
  <chart:ChartAxisTickStyle Stroke="#b0b3b8"/>
 </chart:NumericalAxis.MajorTickStyle>
 <chart:NumericalAxis.MinorTickStyle>
  <chart:ChartAxisTickStyle Stroke="#b0b3b8"/>
 </chart:NumericalAxis.MinorTickStyle>
</chart:NumericalAxis>
Chart color customization
By assigning fill colors to each chart, we can improve the appearance of the series.
<!--Chart 1 -->

<chart:AreaSeries Fill="#F247CC"/>

<!--Chart 2 -->

<chart:AreaSeries Fill="#2C9CEE"/>
After executing the previous code examples, our output will look like the following image.
GitHub reference
For more details, refer to the demo on GitHub.
Conclusion
Thanks for reading! In this blog, we have seen how to effectively visualize US tech companies’ growing adoption of dual-class voting structures using the .NET MAUI Area Chart. We highly encourage you to try the steps outlined in this blog and share your feedback in the comment section below.
You can also contact us via our support forum, support portal, or feedback portal. We are always eager to help you!


