As software developers, we often need help with our JavaScript code. Troubleshooting these problems efficiently and effectively is crucial for delivering high-quality software.
This article will teach you 10 valuable tips for improving your JavaScript troubleshooting skills. These tips will help you debug like an expert, regardless of whether you are an experienced developer or just beginning your coding journey. By implementing these tips, you will gain confidence and efficiency in resolving JavaScript issues:
- Understand the Problem
- Divide and Conquer
- Leverage Browser Developer Tools
- Employ Debugging Techniques
- Use Assertions and Unit Tests
- Review Error Messages and Stack Traces
- Log and Analyze the Data
- Consult Documentation and Online Resources
- Experiment with Code Isolation
- Seek a Fresh Perspective
1. Understand the Problem
Before diving into the code, it’s essential to understand the problem at hand clearly. Talk to stakeholders, gather detailed information about the issue, and reproduce the problem if possible. This step sets the foundation for successful troubleshooting.
Example
Suppose you’re working on a web application, and users report that clicking a button does not perform the desired action. By reproducing the problem and analyzing the user’s actions, you can narrow down the issue to a specific function call.
document.getElementById('myButton').addEventListener('click', () => {
  // Perform the desired action
});
2. Divide and Conquer
Break down your code into smaller parts and test each component independently. This approach helps isolate the problematic area and narrow your search for the bug. Use console.log statements or modern debugging tools to examine the intermediate results and identify where things go wrong.
Example
Imagine you have a complex algorithm that sorts an array of numbers but produces incorrect results. By splitting the sorting logic into smaller functions and logging the intermediate steps, you can identify the part of the algorithm that introduces the bug.
function sortArray(array) {
  // Divide and conquer by splitting the sorting logic.
  const sortedLeft = mergeSort(array.slice(0, array.length / 2));
  const sortedRight = mergeSort(array.slice(array.length / 2));

  // Merge the sorted parts.
  return merge(sortedLeft, sortedRight);
}

function mergeSort(array) {
  // Perform the sorting algorithm.
  console.log(‘Sorting array:’, array);

  // …
}

function merge(left, right) {
  // Merge the sorted arrays.
  console.log('Merging:', left, right);

  // ...
}
3. Leverage Browser Developer Tools
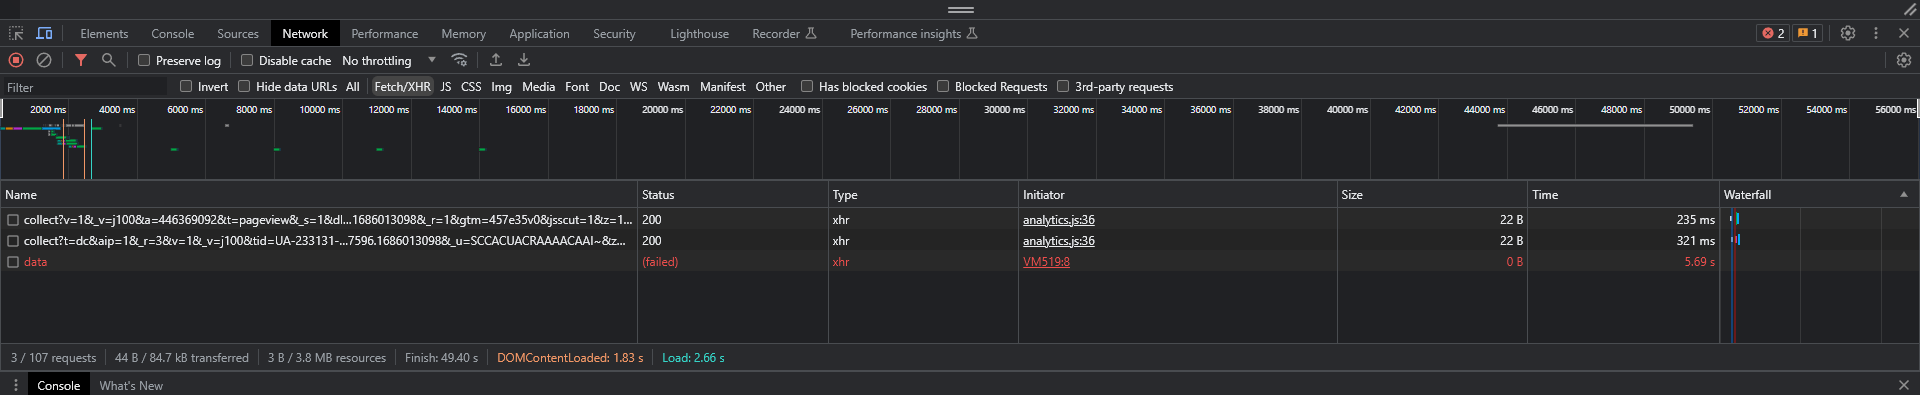
Modern web browsers provide robust developer tools packed with valuable features. These tools include a JavaScript console, network analyzer, DOM inspector, performance profilers, and more. Utilize these tools to inspect variables, track function calls, analyze network requests, and diagnose performance bottlenecks.
Example
Suppose you encounter an issue with an AJAX request not returning the expected data. Using the network analyzer in the browser’s developer tools, you can inspect the request and response details, headers, and payloads to identify anomalies.
// Create a new XMLHttpRequest object.
var xhr = new XMLHttpRequest();

// Open a GET request to the API endpoint.
xhr.open('GET', 'https://api.example.com/data', false);

// Send the request.
xhr.send();

// Check the response status.
if (xhr.status === 200) {
  console.log('Received data:', xhr.responseText);
  // Process the received data.
} else {
  console.error('Error fetching data:', xhr.status);
}
4. Employ Debugging Techniques
JavaScript offers several debugging techniques to assist you. Place breakpoints in your code to pause execution at specific points and examine variable values. Step through the code line by line to understand the flow and identify where things go awry. Modern integrated development environments (IDEs) often have built-in debugging capabilities that simplify this process.
Additionally, you can utilize the debugger statement in your code. When executed, this statement triggers he browser’s debugger tool, allowing you to inspect variables, step through the code, and pinpoint issues.
The following code shows how a debugger statement was added to invoke a debugger when the function is invoked.
function troubleshootCode() {
  .....
  .....
  // Do potentially buggy stuff to examine, step through, etc.
  debugger;
  .....
  .....
}
Example
Consider a scenario where you’re experiencing unexpected behavior in a loop. By setting a breakpoint inside the loop, you can inspect the iteration variables and analyze the loop’s behavior, helping you pinpoint the cause of the issue.
for (let i = 0; i < array.length; i++) {
  // Some code here.

  // Set a breakpoint on the line below to inspect the iteration variables.
  console.log('Iteration:', i, 'Value:', array[i]);

  // More code here.
}
By setting a breakpoint on the console.log statement, you can pause the loop’s execution and examine the current iteration’s index (i) and the corresponding value array[i]. This allows you to analyze the loop’s behavior and identify unexpected values or logic.
Another helpful tool for debugging is the console.trace() method. It outputs a stack trace to the console, displaying the sequence of function calls that led to the current point in the code.
Example Stack Trace Error
Suppose you have the following code snippet that encounters an error.
function divide(a, b) {
  if (b === 0) {
    throw new Error('Division by zero');
  }
  return a / b;
}

function calculateRatio(x, y) {
  const ratio = divide(x, y);
  return ratio;
}

function performCalculation() {
  try {
    const result = calculateRatio(10, 0);
    console.log('Result:', result);
  } catch (error) {
    console.error('An error occurred:', error.message);
    console.trace();
  }
}

performCalculation();
In this example, when calculateRatio(10, 0) is called, it encounters a division by zero error and throws an error object with the message “Division by zero”. The console.trace() method is then used to output the stack trace to the console.
When you run this code, you will see the following stack trace in the console.
An error occurred: Division by zero
    at divide (script.js:3:11)
    at calculateRatio (script.js:8:19)
    at performCalculation (script.js:14:17)
    at script.js:18:1
The stack trace indicates that the error occurred at line 3 in the divide() function, which was called by the calculateRatio() function at line 8, which in turn was called by the performCalculation() function at line 14. The error was ultimately triggered at line 18.
By examining the stack trace, you can trace the flow of function calls and identify the specific lines where the error originated.

5. Use Assertions and Unit Tests
Adding assertions and writing unit tests can aid in detecting bugs and monitoring your code’s correctness. Assertions verify that certain conditions hold true at specific points, helping you catch issues early. Unit tests ensure that your functions and components produce the expected output for different inputs.
Example
Suppose you encounter a bug in a function that calculates the sum of an array. Writing a unit test that verifies the expected result for various input arrays lets you quickly identify if the bug lies in the calculation logic.
function sumArray(array) {
  let sum = 0;
  for (let i = 0; i < array.length; i++) {
    sum += array[i];
  }
  return sum;
}

// Assertion to check if the sum of [1, 2, 3] is 6
console.assert(sumArray([1, 2, 3]) === 6, 'Incorrect Sum');

// More test cases here...
Using assertions and writing comprehensive unit tests, you can quickly catch potential issues and ensure your functions produce the expected results. This approach helps maintain the correctness of your code even as it evolves.
6. Review Error Messages and Stack Traces
When encountering an “undefined is not a function” error, the stack trace will show you the sequence of function calls. By examining the relevant line numbers and variables in those functions, you can determine the source of the issue.
Example
function calculateTotal(price, quantity) {
  return price * quantity;
}

function displayTotal() {
  const price = getProductPrice(); // Assume this function is causing the error.
  const quantity = getQuantity();

  const total = calculateTotal(price, quantity);
  console.log('Total:', total);
}

displayTotal();
In this example, if the getProductPrice() function is undefined, the error message and stack trace will help identify the source of the problem.
7. Log and Analyze the Data
When working with complex data transformations, logging the intermediate data structures can reveal inconsistencies or unexpected changes, leading you closer to the root cause of the problem.
Example
function processData(data) {
  console.log('Input Data:', data);

  // Perform data transformations.
  console.log('Transformed Data:', transformedData);

  // Perform more operations.
  console.log('Final Resultant Data:', finalResultantData);
}

const data = fetchData(); // Assume this function fetches the data.
processData(data);
You can analyze the logged values to understand how the data is being transformed and if any issues arise by logging the input, transformed, and final resultant data.
8. Consult Documentation and Online Resources
When troubleshooting, consult the documentation, forums, and online resources to gather insights and solutions. Websites like Stack Overflow, MDN Web Docs, and Syncfusion’s support forums can provide valuable information for common JavaScript issues.
For instance, suppose you encounter an error related to a specific JavaScript method. In that case, consulting the official documentation can provide explanations, usage examples, and potential solutions.
9. Experiment with Code Isolation
Creating a minimal, isolated version of your code that reproduces the problem helps simplify the troubleshooting process and understand the root cause.
For instance, if you encounter a bug in a React component, create a standalone sandbox project or CodePen with only the necessary code. This isolation can help identify whether the issue stems from the component or other factors in the more extensive application.
10. Seek a Fresh Perspective
When you’ve exhausted your troubleshooting options, seeking a fresh perspective can be valuable. Engage with fellow developers, participate in code review sessions, or collaborate with teammates to gain insights and potential solutions.
For instance, present your code to a colleague or join a developer community where you can discuss the issue and ask for suggestions. Another developer may provide a different perspective or approach that can help you uncover the problem.
Conclusion
We appreciate you taking the time to read this blog post about effectively debugging JavaScript code. This ability can significantly impact your productivity as a software developer. By implementing these suggestions, you can optimize your troubleshooting approach, enhance your ability to detect and fix bugs and become a more skilled JavaScript programmer.
The Syncfusion JavaScript suite is the only collection of tools you’ll ever require to create an application. One package includes over 80 high-performance, lightweight, modular, and responsive UI components. Try the free trial and test the controls today.
If you have any inquiries or feedback, please get in touch with us via our support forums, support portal, or feedback portal. We’re always eager to help!