Override default SVG size in chart
Hi team,
the default size of chart svg is 600*450, I'm trying to reset it by setting its parent container style:{ display:block} as mentioned in this post https://www.syncfusion.com/forums/142081/disable-default-width-and-size-of-svg-container
However, this approach might work at first, but it doesn't work for a chart inside tabitem. Also, if you went to some other sibling pages and went back, the svg size will be set to default value again.
Is there anyway to reset svg size to its parent size?
Thanks for your help.
SIGN IN To post a reply.
3 Replies
SM
Srihari Muthukaruppan
Syncfusion Team
December 20, 2019 04:05 AM UTC
Hi Feifan,
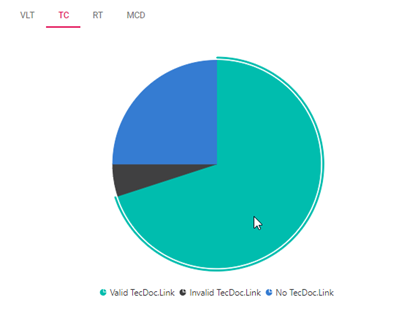
We have analyzed your query. From that, we would like to let you know that the chart is responsive with respect to the width and height of its parent element, if its zero, then it will render with its default size(600 * 450). we suggest you to use the below workaround solution to achieve your requirement. In which we have provided the required height for parent div and the style of chart and accumulation chart has been set to inherit to achieve your requirement. Please find below sample, code snippet and screenshot.
Sample: https://www.syncfusion.com/downloads/support/directtrac/general/ze/resizedTabNavigation494041770.zip
Code Snippet:
|
<style>
.e-content.e-lib.e-touch {
height: inherit;
}
.e-accumulationchart {
height: inherit;
}
.e-chart {
height: inherit;
}
.e-item.e-active {
height: inherit;
}
</style>
<div class="e-tab-section">
<div class="col-lg-8 Content-wrapper control-section">
<EjsTab Height="250px" OverflowMode="@Mode" HeaderPlacement="@Header">
<TabItems>
<TabItem>
<ChildContent>
<TabHeader Text="VLT"></TabHeader>
</ChildContent>
<ContentTemplate>
<div style="height: 100%; width: 100%;">
<EjsChart Width="100%" Height="100%">
<ChartPrimaryXAxis ValueType="Syncfusion.EJ2.Blazor.Charts.ValueType.Category"></ChartPrimaryXAxis>
<ChartSeriesCollection>
<ChartSeries DataSource="@DataSource" Name="Sales Ready Articles" XName="KW" YName="SalesReady" Type="ChartSeriesType.StackingColumn">
</ChartSeries>
<ChartSeries DataSource="@DataSource" Name="Not Sales Ready Articles" XName="KW" YName="NotSalesReady" Type="ChartSeriesType.StackingColumn">
</ChartSeries>
</ChartSeriesCollection>
</EjsChart>
</div>
</ContentTemplate>
</TabItem>
<TabItem>
<ChildContent>
<TabHeader Text="TC"></TabHeader>
</ChildContent>
<ContentTemplate>
<div style="height: 100%; width: 100%;">
<EjsAccumulationChart Width="100%" Height="100%" @ref="@accumulationChart" LegendSettings="(new AccumulationChartLegendSettings() { Position = LegendPosition.Bottom})">
<AccumulationChartSeriesCollection>
<AccumulationChartSeries DataSource="@tecDocPieData" XName="Label" YName="Percentage"></AccumulationChartSeries>
</AccumulationChartSeriesCollection>
</EjsAccumulationChart>
</div>
</ContentTemplate>
</TabItem>
<TabItem>
<ChildContent>
<TabHeader Text="RT"></TabHeader>
</ChildContent>
<ContentTemplate>
<div style="height: 100%; width: 100%;">
<EjsAccumulationChart Width="100%" Height="100%" @ref="@accumulationChart" LegendSettings="(new AccumulationChartLegendSettings() { Position = LegendPosition.Bottom})">
<AccumulationChartSeriesCollection>
<AccumulationChartSeries DataSource="@tecDocPieData" XName="Label" YName="Percentage"></AccumulationChartSeries>
</AccumulationChartSeriesCollection>
</EjsAccumulationChart>
</div>
</ContentTemplate>
</TabItem>
<TabItem >
<ChildContent>
<TabHeader Text="MCD"></TabHeader>
</ChildContent>
<ContentTemplate>
<div style="height: 100%; width: 100%;">
<EjsChart Width="100%" Height="100%">
<ChartPrimaryXAxis ValueType="Syncfusion.EJ2.Blazor.Charts.ValueType.DateTime" LabelFormat="dd.MM.yyyy" IntervalType="IntervalType.Months"></ChartPrimaryXAxis>
<ChartSeriesCollection>
<ChartSeries DataSource="@coverageData" XName="Date" YName="Percentage" Type="ChartSeriesType.Area">
</ChartSeries>
</ChartSeriesCollection>
</EjsChart>
</div>
</ContentTemplate>
</TabItem>
</TabItems>
</EjsTab>
</div>
</div> |
Screenshot:
Let us know if you have any concerns.
Thanks,
Srihari
AO
Andrew Olowookere
November 18, 2021 10:35 AM UTC
Hi,
I am running .Net 5 blazor, with syncfusion version 19.3.0.54 trial, I experience the above issue with the default value on the SVG, I have applied this suggestion but didn’t resolve the issue, but how I resolved it is by applying the below.
<style>
.e-chart svg {
width: inherit !important;
}
</style>
Thanks,
Andrew
DG
Durga Gopalakrishnan
Syncfusion Team
November 19, 2021 03:10 PM UTC
Hi Andrew,
We have ensured your reported scenario in latest version; chart and accumulation chart is rendered properly based on parent element height and width. We have attached the tested sample for your reference. Please check with below snippet and sample.
|
.e-chart {
height: inherit !important;
width: inherit !important;
} |
.e-accumulationchart {
height: inherit !important;
width: inherit !important;
} |
 |
 |
Kindly revert us if you have any concerns.
Regards,
Durga G
SIGN IN To post a reply.
- 3 Replies
- 4 Participants
-
FE Feifan
- Dec 18, 2019 05:08 AM UTC
- Nov 19, 2021 03:10 PM UTC
