Scale the chart correctly
When I add the chart to the page how can I get it to scale to the correct size - the chart is not resizing. I guess I need to set the height?
SIGN IN To post a reply.
3 Replies
SM
Srihari Muthukaruppan
Syncfusion Team
December 18, 2019 09:53 AM UTC
Hi Alex,
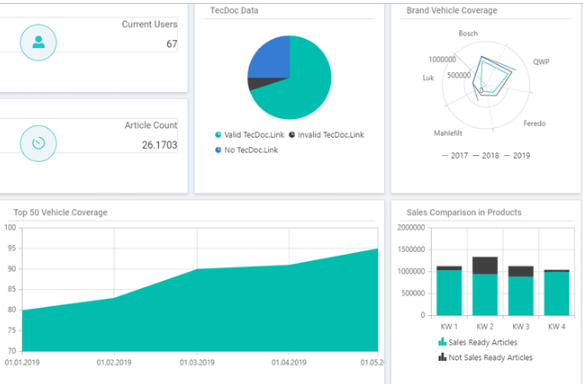
We have analyzed your query. From that, We would like to let you know that the chart is responsive with respect to the width and height of its parent element, if its zero, then it will render with its default size(600 * 450). we suggest you to use the below workaround solution to achieve your requirement. In that we have refresh the chart once we got the parent size. Based on your requirement we have also prepared a sample using dashboard layout for your reference. Please find below code snippet and sample.
Code Snippet:
|
protected override async Task OnAfterRenderAsync(bool firstRender)
{
//OnAfterRenderAsync will be triggered after the component rendered.
await Task.Delay(500);
// refreshing all the chart components to fit within the panel
this.chart1.Refresh();
this.chart2.Refresh();
this.chart3.Refresh();
} |
Screenshot:
If this solution doesn’t meet the requirement, kindly revert us with more information which will be more helpful for further analysis and provide you the solution sooner.
Regards,
Srihari M
AW
Alex Whittle
December 19, 2019 10:10 AM UTC
Thanks for the reply. Not sure the correct attachment was added as it doesn't seem to have any sizing code?


I've added a width and height to the outside div and added the refresh code
and no change.
looks like this, as you can see the chart is still bigger than the div it is placed in
SM
Srihari Muthukaruppan
Syncfusion Team
December 20, 2019 04:04 AM UTC
Hi Alex,
Sorry for the inconvenience.
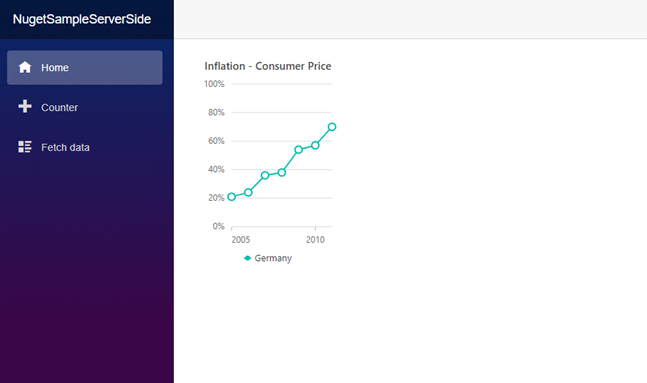
We have analyzed your query. From that, we suggest you to use the below workaround solution to achieve your requirement. In which we have provided the required height for parent div and the style of chart has been set to inherit using class name to achieve your requirement. Please find below sample, code snippet and screenshot.
Sample: https://www.syncfusion.com/downloads/support/directtrac/general/ze/ChartSizeControl-1238990809.zip
Code Snippet:
|
<style>
.e-chart {
height: inherit !important;
width: inherit !important;
}
</style>
<div class="control-section">
<div style="height: 316px; width: 200px">
<EjsChart Title="Inflation - Consumer Price" >
<ChartArea><ChartAreaBorder Width="0"></ChartAreaBorder></ChartArea>
<ChartPrimaryXAxis ValueType="Syncfusion.EJ2.Blazor.Charts.ValueType.DateTime" LabelFormat="y" IntervalType="IntervalType.Years" EdgeLabelPlacement="EdgeLabelPlacement.Shift">
<ChartAxisMajorGridLines Width="0"></ChartAxisMajorGridLines>
</ChartPrimaryXAxis>
<ChartPrimaryYAxis LabelFormat="{value}%" RangePadding="ChartRangePadding.None" Minimum="0" Maximum="100" Interval="20">
<ChartAxisLineStyle Width="0"></ChartAxisLineStyle>
<ChartAxisMajorTickLines Width="0"></ChartAxisMajorTickLines>
</ChartPrimaryYAxis>
<ChartTooltipSettings Enable="true"></ChartTooltipSettings>
<ChartSeriesCollection>
<ChartSeries DataSource="@chartData" Name="Germany" XName="xValue" Width="2"
Opacity="1" YName="yValue" Type="ChartSeriesType.Line">
<ChartMarker Visible="true" Width="10" Height="10">
</ChartMarker>
</ChartSeries>
</ChartSeriesCollection>
</EjsChart>
</div>
</div>
@code{
public class LineChartData
{
public DateTime xValue { get; set; }
public double yValue { get; set; }
public double yValue1 { get; set; }
}
public List<LineChartData> chartData = new List<LineChartData>
{
new LineChartData { xValue = new DateTime(2005, 01, 01), yValue = 21, yValue1 = 28 },
new LineChartData { xValue = new DateTime(2006, 01, 01), yValue = 24, yValue1 = 44 },
new LineChartData { xValue = new DateTime(2007, 01, 01), yValue = 36, yValue1 = 48 },
new LineChartData { xValue = new DateTime(2008, 01, 01), yValue = 38, yValue1 = 50 },
new LineChartData { xValue = new DateTime(2009, 01, 01), yValue = 54, yValue1 = 66 },
new LineChartData { xValue = new DateTime(2010, 01, 01), yValue = 57, yValue1 = 78 },
new LineChartData { xValue = new DateTime(2011, 01, 01), yValue = 70, yValue1 = 84 },
};
} |
Screenshot:
If you still face this issue. Please share the following information which will be more helpful for further analysis and provide you the solution sooner.
- Try to reproduce the reported scenario in the above sample
- Share the details if you have done any other customization in your sample.
- Share the card customization done in your sample
Let us know if you have any concerns
Regards,
Srihari
SIGN IN To post a reply.
- 3 Replies
- 2 Participants
-
AW Alex Whittle
- Dec 16, 2019 11:19 PM UTC
- Dec 20, 2019 04:04 AM UTC
