- Home
- Forum
- Angular - EJ 2
- Documentation on chart sizes is unclear
Documentation on chart sizes is unclear
looking at the page here:
There are two chapters:
- size of the container
- size of the chart area
Looking at the example code for both variants i cannot see a difference between them that would cause the size of the chart-area to be set.
In both cases the wodth- and height-properties are set the same way.
BTW:
The reason i was looking for this is my need to find out the actual number of pixels available to the inside of the chart.
i.e.
We have high resolution data in the Backend and the API exposes it pre-interpolated.
In order to avoid a re-interpolation in the FE, we are aiming to have the chart identify the exact number of pixels it needs to fill and then we request that from the API.
Defining it programatically by setting the size of the chart-area would be my second best solution.
SIGN IN To post a reply.
4 Replies
BF
Benjamin Fritz
November 20, 2019 12:30 PM UTC
Could still not find a way to set the area via attribues but at least i managed to find a way to read the actual render area pixel-size:
In the chart object that you have either via ViewChild or as part of a resize event data payload, there is a property 'initialClipRect'.
That contain an object that has a property 'width' that has the pixelwidth of the actual data render area
SM
Srihari Muthukaruppan
Syncfusion Team
November 21, 2019 03:48 PM UTC
Hi Benjamin,
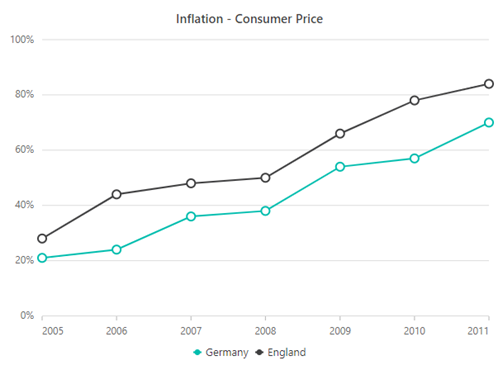
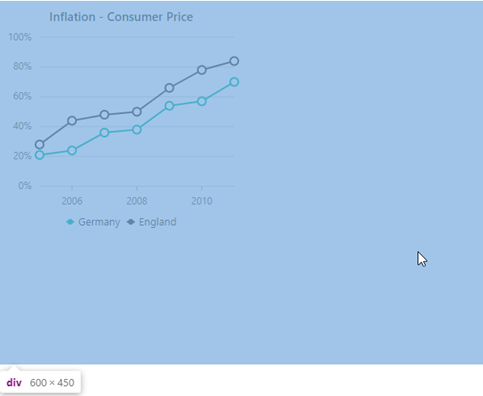
We have analyzed your query. From that we would like to let you know that when we set the size for the chart then the height and width will be calculated based on container size, else the chart will be rendered for the whole container size. Please find below code snippet, screenshot and sample.
Code Snippet:
|
Size of container |
Size of chart |
|
<div style="width: 600px; height: 400px">
<ejs-chart style='display:block' id='chartcontainer' [title]='title' [primaryXAxis]='primaryXAxis' [primaryYAxis]='primaryYAxis'
[tooltip]='tooltip' (load)='load($event)' [chartArea]='chartArea' >
<e-series-collection>
<e-series [dataSource]='data' type='Line' xName='x' yName='y' name='Germany' width=2 [marker]='marker'> </e-series>
<e-series [dataSource]='data1' type='Line' xName='x' yName='y' name='England' width=2 [marker]='marker'> </e-series>
</e-series-collection>
</ejs-chart>
</div> |
<div style="width: 600px; height: 400px">
<ejs-chart style='display:block' id='chartcontainer' width="300" height="300" [title]='title' [primaryXAxis]='primaryXAxis' [primaryYAxis]='primaryYAxis'
[tooltip]='tooltip' (load)='load($event)' [chartArea]='chartArea'>
<e-series-collection>
<e-series [dataSource]='data' type='Line' xName='x' yName='y' name='Germany' width=2 [marker]='marker'> </e-series>
<e-series [dataSource]='data1' type='Line' xName='x' yName='y' name='England' width=2 [marker]='marker'> </e-series>
</e-series-collection>
</ejs-chart>
</div> |
Screenshot:
|
While setting Size of container |
While setting Size of chart |
 |
 |
Let us know, if you have any concerns.
Regards,
Srihari M.
BF
Benjamin Fritz
November 21, 2019 05:17 PM UTC
Hi Srihari,
thanks for the Example, it helps me understand what is meant with "the charts container".
I was confused by the documentation page ( https://ej2.syncfusion.com/angular/documentation/chart/chart-dimensions/#size-for-container ) as it doesn't show two different things but it has code like in your box "Size of Chart" in the example code for both cases.
Thanks for your prompt reply
Benjamin
SM
Srihari Muthukaruppan
Syncfusion Team
November 22, 2019 06:03 AM UTC
Hi Benjamin,
Most welcome.
We have also logged a documentation task for this and the changes will be available in our main release. We will let you know once it will be refreshed in online.
Let us know, if you have any concerns.
Regards,
Srihari M
SIGN IN To post a reply.
- 4 Replies
- 2 Participants
-
BF Benjamin Fritz
- Nov 20, 2019 10:13 AM UTC
- Nov 22, 2019 06:03 AM UTC

