Starting in 2019, the Reporting control is no longer included in Essential Studio®. If you're experiencing issues with the Syncfusion� Reporting Platform, Report Viewer, Report Designer, or Report Writer, we recommend migrating to Bold Reports, our dedicated reporting platform.
Bold Reports offers a comprehensive suite of tools and features for all your reporting needs, and we will help you make a smooth transition from the discontinued control. Our support team at https://support.boldreports.com/ is here to assist you with any questions or difficulties you may encounter during the migration process.
We thank you for choosing Syncfusion� and appreciate your understanding.
Pie Chart not working in export as PDF
Hi,
I'm using report viewer control in AngularJS. When I export a report with pie chart as pdf, the pie chart is not coming in the pdf file. Is this a bug?
Thanks,
Joe
Joe
SIGN IN To post a reply.
19 Replies
VS
Vinoth Srinivasan
Syncfusion Team
November 19, 2019 08:56 AM UTC
Hi Joe,
We were not able to reproduce the mentioned pie chart not exporting in PDF export at our end. So, could you please share your issue reproducible report file and our scripts and assemblies versions to validate the mentioned problem at our end.
Regards,
Vinoth S.
JS
Joe Samraj
November 19, 2019 11:45 AM UTC
Hi Vinoth,
Attachment: Report_b6b4051.zip
Thanks for your reply. I have attached the rdl and html files I'm using. One more question, are you supporting SSRS 2019?
Thanks,
Joe
Attachment: Report_b6b4051.zip
VS
Vinoth Srinivasan
Syncfusion Team
November 22, 2019 10:59 AM UTC
Hi Joe,
Please find the below response for your queries.
|
Query |
Response |
|
When I export a report with pie chart as pdf, the pie chart is not coming in the pdf file. |
We have checked the mentioned issue with your shared report file and it is exporting properly at our end. So, could you please confirm are you using ASP.NET or ASP.NET Core Web API service with Angular JS application. If you are using ASP.Net Core, then we need to use PhantomJS to export the data visualization report items. |
|
One more question, are you supporting SSRS 2019? |
We are getting some issue when installing the SSRS 2019 in our local system. We will fix and provide the details with SSRS 2019 and our Report Viewer control ASAP. |
Regards,
Vinoth S.
VS
Vinoth Srinivasan
Syncfusion Team
November 27, 2019 03:07 AM UTC
Hi Joe,
We are facing some technical issue while installing 2019 SSRS Server and will update you the details by 28th November 2019.
Regards,
Vinoth S.
VS
Vinoth Srinivasan
Syncfusion Team
November 28, 2019 03:24 PM UTC
Hi Joe,
Thanks for your patience.
We have checked SSRS 2019 reports in our Report Viewer control and reports are rendering properly in our Report Viewer control.
Regards,
Vinoth S.
JS
Joe Samraj
December 5, 2019 06:57 AM UTC
Thanks for the update Vinoth. I'm using .Net Core for the API. Do you have any example for using PhantomJS to export the data visualization report items
Thanks,
Joe
VS
Vinoth Srinivasan
Syncfusion Team
December 5, 2019 11:24 AM UTC
Hi Joe,
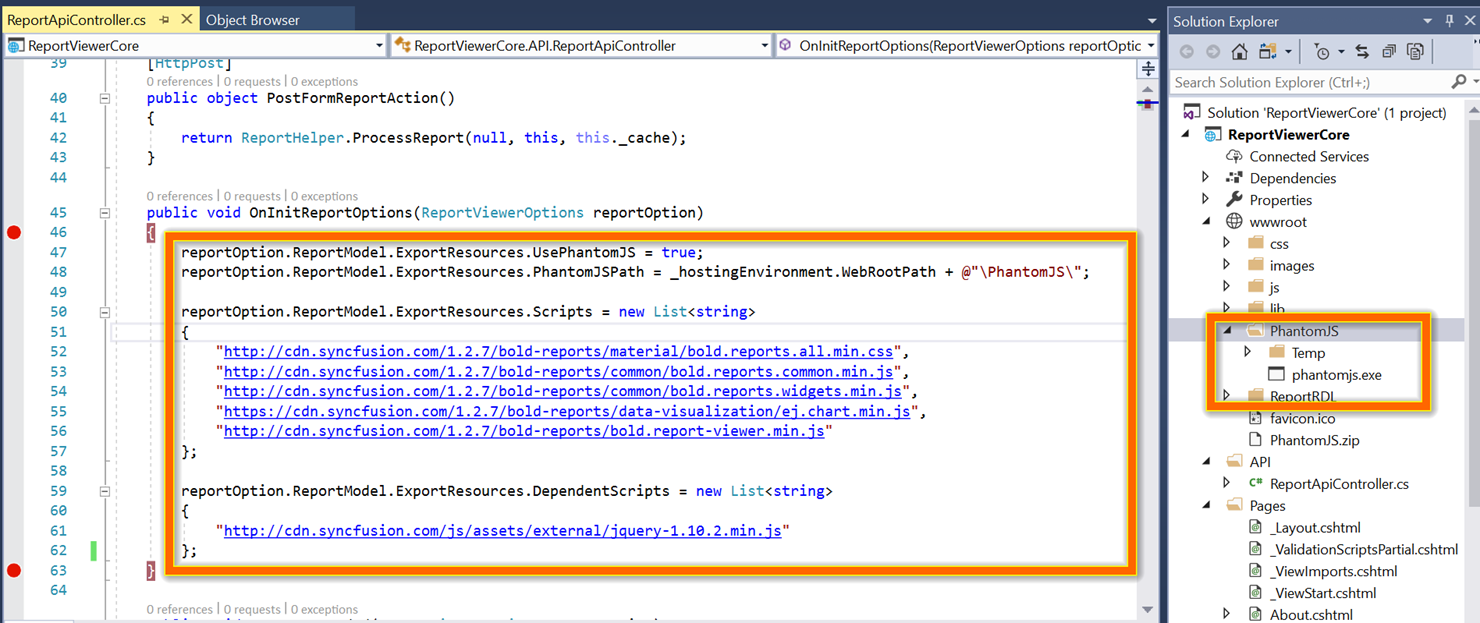
Please find the below step for how to add the PhantomJS in ASP.NET Core Service application.
Step 1: Add the below attached folder in “wwwroot” folder.
PhantomJS: https://www.syncfusion.com/downloads/support/directtrac/general/ze/PhantomJS1832771641.zip
Step 2: Add the script and PhantomJS exe in OnInitReportOption method as shown in below snap.
|
public void OnInitReportOptions(ReportViewerOptions reportOption)
{
reportOption.ReportModel.ExportResources.UsePhantomJS = true;
reportOption.ReportModel.ExportResources.PhantomJSPath = _hostingEnvironment.WebRootPath + @"\PhantomJS\";
reportOption.ReportModel.ExportResources.Scripts = new List<string>
{
};
reportOption.ReportModel.ExportResources.DependentScripts = new List<string>
{
};
} |
Regards,
Vinoth S.
JS
Joe Samraj
December 9, 2019 05:47 AM UTC
Thanks Vinoth,
I have tried that, but it seems I'm missing some reference here.
reportOption.ReportModel.ExportResources - is not found.
should I add any other library here?
Thanks,
Joe
VS
Vinoth Srinivasan
Syncfusion Team
December 9, 2019 01:17 PM UTC
Hi Joe,
We suspect are you using the older version of our assembly. Could you please share the assembly version details with us proceed further on this?
Regards,
Vinoth S.
JS
Joe Samraj
December 10, 2019 04:54 AM UTC
Hi Vinoth,
I'm using the below assemblies
Syncfusion.EJ.AspNet.Core - 17.3.0.33
Syncfusion.EJ.ReportViewer.AspNet.Core - 17.3.0.33
Thanks,
Joe
VS
Vinoth Srinivasan
Syncfusion Team
December 10, 2019 03:12 PM UTC
Hi Joe,
We have provided PhantomJS support with Bold Reports, so please consider to migrate for Bold Reports and we have shared Bold Reports details in the forum #149790.
Regards,
Vinoth S
JS
Joe Samraj
December 11, 2019 08:47 AM UTC
Thanks for the details Vinoth. We are using AngularJS, is it supported in Bold Reports? if yes could you please provide the link.
Thanks,
Joe
VS
Vinoth Srinivasan
Syncfusion Team
December 12, 2019 10:55 AM UTC
Hi Joe,
We did not considered AngularJS for Bold Reports, since it’s in LTS from July 1st 2018 onwards. Please refer the below forum.
So, we suggest you to render our jQuery control in your AngularJS application and you can refer the below online forum for using the jQuery control in an AngularJS application.
Reference : How to use jQuery in AngularJS application
Regards,
Vinoth S.
JS
Joe Samraj
June 10, 2020 05:22 PM UTC
Hi Vinoth,
I have updated the code according to the document as below. Still the pdf export doesn't have the pie chart.
Below are the versions I'm using
BoldReports.Net.Core - 2.2.34
Microsoft.AspNetCore.App - 2.2.0
using System;
using System.Collections.Generic;
using System.Linq;
using System.Threading.Tasks;
using BoldReports.Web;
using BoldReports.Web.ReportViewer;
using Microsoft.AspNetCore.Http;
using Microsoft.AspNetCore.Mvc;
using Microsoft.Extensions.Logging;
using SSRSAuth.Configuration;
namespace SSRSAuth.Controllers
{
[Route("api/[controller]/[action]")]
[Microsoft.AspNetCore.Cors.EnableCors("AllowAllOrigins")]
public class ReportAPIController : Controller,IReportController
{
private Microsoft.Extensions.Caching.Memory.IMemoryCache _cache;
private Microsoft.AspNetCore.Hosting.IHostingEnvironment _hostingEnvironment;
private ReportServerConfig _reportServerConfig { get; }
private PowerBIDBConfig _powerBIDBConfig { get; }
private readonly ILogger _logger;
// Post action to process the report from server based json parameters and send the result back to the client.
public ReportAPIController(Microsoft.Extensions.Caching.Memory.IMemoryCache memoryCache,
Microsoft.AspNetCore.Hosting.IHostingEnvironment hostingEnvironment,
ReportServerConfig reportServerConfig,
PowerBIDBConfig powerBIDBConfig,
ILogger<ReportAPIController> logger
)
{
_cache = memoryCache;
_hostingEnvironment = hostingEnvironment;
_reportServerConfig = reportServerConfig;
_powerBIDBConfig = powerBIDBConfig;
_logger = logger;
}
// Post action to process the report from server based json parameters and send the result back to the client.
[HttpPost]
public object PostReportAction([FromBody] Dictionary<string, object> jsonArray)
{
return ReportHelper.ProcessReport(jsonArray, this, this._cache);
}
// Method will be called to initialize the report information to load the report with ReportHelper for processing.
public void OnInitReportOptions(ReportViewerOptions reportOption)
{
reportOption.ReportModel.ExportResources.UsePhantomJS = true;
reportOption.ReportModel.ExportResources.PhantomJSPath = _hostingEnvironment.WebRootPath + @"\PhantomJS\";
reportOption.ReportModel.ExportResources.Scripts = new List<string>
{
"https://cdn.boldreports.com/2.2.32/scripts/common/bold.reports.widgets.min.js",
"https://cdn.boldreports.com/2.2.32/scripts/common/bold.reports.common.min.js",
//Chart component script
"https://cdn.boldreports.com/2.2.32/scripts/data-visualization/ej.chart.min.js",
//Gauge component scripts
"https://cdn.boldreports.com/2.2.32/scripts/common/ej2-base.min.js",
"https://cdn.boldreports.com/2.2.32/scripts/common/ej2-data.min.js",
"https://cdn.boldreports.com/2.2.32/scripts/common/ej2-pdf-export.min.js",
"https://cdn.boldreports.com/2.2.32/scripts/common/ej2-svg-base.min.js",
"https://cdn.boldreports.com/2.2.32/scripts/data-visualization/ej2-lineargauge.min.js",
"https://cdn.boldreports.com/2.2.32/scripts/data-visualization/ej2-circulargauge.min.js",
//Map component script
"https://cdn.boldreports.com/2.2.32/scripts/data-visualization/ej.map.min.js",
//Report Viewer Script
"https://cdn.boldreports.com/2.2.32/scripts/bold.report-viewer.min.js"
};
reportOption.ReportModel.ExportResources.DependentScripts = new List<string>
{
"https://code.jquery.com/jquery-1.10.2.min.js"
};
try
{
string basePath = _hostingEnvironment.WebRootPath;
var credential = new DataSourceCredentials()
{
ConnectionString = _powerBIDBConfig.ConnectionString,
Name = _powerBIDBConfig.Name,
UserId = _powerBIDBConfig.Username,
Password = _powerBIDBConfig.Password
};
reportOption.ReportModel.ReportServerCredential = new System.Net.NetworkCredential(_reportServerConfig.Username, _reportServerConfig.Password);
reportOption.ReportModel.DataSourceCredentials.Add(credential);
}
catch (Exception ex)
{
_logger.LogError(ex.Message);
}
}
// Method will be called when reported is loaded with internally to start to layout process with ReportHelper.
public void OnReportLoaded(ReportViewerOptions reportOption)
{
}
//Get action for getting resources from the report
[ActionName("GetResource")]
[AcceptVerbs("GET")]
// Method will be called from Report Viewer client to get the image src for Image report item.
public object GetResource(ReportResource resource)
{
return ReportHelper.GetResource(resource, this, _cache);
}
[HttpPost]
public object PostFormReportAction()
{
return ReportHelper.ProcessReport(null, this, _cache);
}
}
}
VS
Vinoth Srinivasan
Syncfusion Team
June 12, 2020 04:19 AM UTC
Hi Joe,
We were able to reproduce the issue and validating with our source. We will update you the details by 12th June 2020.
Regards,
Vinoth S.
VS
Vinoth Srinivasan
Syncfusion Team
June 14, 2020 05:28 AM UTC
Hi Joe,
Sorry for the delay.
We are still validating the export issue with our source and update you the details by 15th June 2020.
Regards,
Vinoth S.
VS
Vinoth Srinivasan
Syncfusion Team
June 15, 2020 05:29 PM UTC
Hi Joe,
Thanks for your patience.
We have further validate the reported export issue and the issue occurs due to the below script.
"https://cdn.boldreports.com/2.2.32/scripts/common/ej2-data.min.js",
So, as of now we request you to comment the above script in Controller file to export the chart report items and if you still face any issue then please share the sample with us to validate this further. We will check and correct the changes in our documentation.
Regards,
Vinoth S.
JS
Joe Samraj
June 16, 2020 12:37 PM UTC
Thanks a lot Vinoth. This fixed the issue.
Regards,
Joe
VS
Vinoth Srinivasan
Syncfusion Team
June 16, 2020 01:02 PM UTC
Hi Joe,
Thanks for your update. We are glad to hear that the issue has been resolved at your end.
Regards,
Vinoth S.
SIGN IN To post a reply.
- 19 Replies
- 2 Participants
-
JS Joe Samraj
- Nov 18, 2019 09:56 AM UTC
- Jun 16, 2020 01:02 PM UTC
