- Home
- Forum
- ASP.NET Core - EJ 2
- Donut with text center
Donut with text center
Hi,

Is it possible to have text in the center of a donut chart?
Is it possible to replace text on a donut with an icon from font-awesome or other icons.
Regards,
/Stefan
SIGN IN To post a reply.
3 Replies
SM
Srihari Muthukaruppan
Syncfusion Team
October 14, 2019 09:06 AM UTC
Hi Stefan,
Greetings from Syncfusion
Please find the chart related query response.
>>>>>>>>>>>>>>>>>>>>>>>>>>>>>>>>>>>>>>>>>>>>>>>>>>>>>>>>>>>>>>>>>>>>>>>>>>>>>>>>>>>>>>>>>>>>>>>>>>>>>>>>>>>>>>
Query #1: Is it possible to have text in the center of a donut chart ?
We have analyzed your query. From that, we would like to let you know that we can add text element inside the donut using “animationComplete” event. Please find the demo sample below.
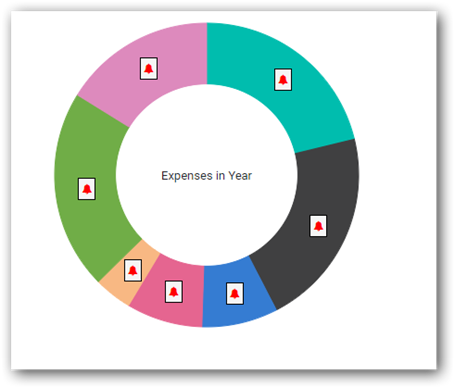
Query 2 : Is it possible to replace text on a donut with an icon from font-awesome or other icons ?
We can replace the data label text with an icon using “template” property in data label. Based on your requirement, we have prepared a sample in EJ2. Please find the below sample and code snippet ,
Sample: https://www.syncfusion.com/downloads/support/directtrac/general/ze/PieChartDataLabel-172213726.zip
Screenshot:
Code Snippet:
[index.cshtml]:
|
<div class="control-section" align='center'>
<ejs-accumulationchart id="container" title="Mobile Browser Statistics" animationComplete="animation">
<e-accumulation-series-collection>
<e-accumulation-series dataSource="ViewBag.dataSource" xName="xValue" yName="yValue" name="Revenue" innerRadius="40%">
<e-accumulationseries-datalabel template="#template" visible="true">
<e-font fontWeight="600" color="red"></e-font>
</e-accumulationseries-datalabel>
</e-accumulation-series>
</e-accumulation-series-collection>
</ejs-accumulationchart>
</div>
<script>
var centerTitle = document.createElement('div');
centerTitle.innerHTML = 'Expenses in Year';
centerTitle.style.position = 'absolute';
centerTitle.style.visibility = 'hidden';
var count = 0;
function animation(args) {
centerTitle.style.fontSize = getFontSize(args.accumulation.initialClipRect.width);
var rect = centerTitle.getBoundingClientRect();
centerTitle.style.top = (args.accumulation.origin.y - rect.height / 2) + 'px';
centerTitle.style.left = (args.accumulation.origin.x - rect.width / 2) + 'px';
centerTitle.style.visibility = 'visible';
let points = args.accumulation.visibleSeries[0].points;
for (var point of points) {
if (point.labelPosition === 'Outside' && point.labelVisible) {
var label = document.getElementById('container_datalabel_Series_0_text_' + point.index);
label.setAttribute('fill', 'black');
}
}
}
document.getElementById('container').appendChild(centerTitle);
</script>
<script id="template">
<div style="background:#f5f5f5; border: 1px solid black; padding: 3px 3px 3px 3px">
<div><i class="fa fa-bell" aria-hidden="true"></i></div>
</div>
</script>
}
} |
To know more information about the tooltip template of chart. Please refer our UG link shown below
UG Link: https://ej2.syncfusion.com/aspnetcore/documentation/chart/data-labels/?no-cache=1#datalabel-template
>>>>>>>>>>>>>>>>>>>>>>>>>>>>>>>>>>>>>>>>>>>>>>>>>>>>>>>>>>>>>>>>>>>>>>>>>>>>>>>>>>>>>>>>>>>>>>>>>>>>>>>>>>>>>>
Let me know if you need further assistance.
Regards,
Srihari.
ST
Stefan
October 16, 2019 10:55 AM UTC
Hi,

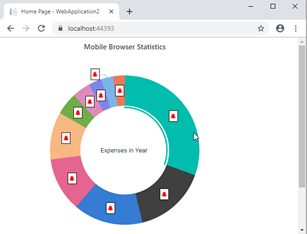
Works great but when decreasing the width of the display the text is not centered anymore.
The image attached is from the sample you provided.
Regards,
Stefan
SM
Srihari Muthukaruppan
Syncfusion Team
October 17, 2019 10:47 AM UTC
Hi Stefan,
Sorry for the inconvenience.
We have validated your query. From that, we suggest you to refresh the chart while resizing using the “resized” event of the chart. Based on that we have prepared a sample and also provided the code snippet for your reference.
Sample: https://www.syncfusion.com/downloads/support/directtrac/general/ze/CenterTitlePosition261581152.zip
Code Snippet:
[index.cshtml]:
|
<ejs-accumulationchart id="container" title="Mobile Browser Statistics" width="80%" load="load" animationComplete="animation" resized="resized">
<e-accumulation-series-collection>
<e-accumulation-series dataSource="ViewBag.dataSource" xName="xValue" yName="yValue" name="Revenue" innerRadius="60%">
</e-accumulation-series>
</e-accumulation-series-collection>
</ejs-accumulationchart>
<script>
var resized = function (args) {
args.accumulation.refresh();
}
</script> |
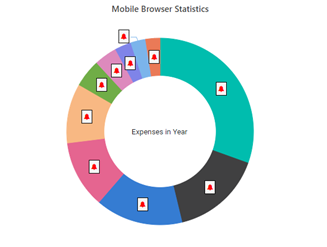
Screenshot:
|
Before resizing |
After resizing |
 |
 |
Let me know, if you have any concerns.
Regards,
Srihari
SIGN IN To post a reply.
- 3 Replies
- 2 Participants
-
ST Stefan
- Oct 11, 2019 05:53 PM UTC
- Oct 17, 2019 10:47 AM UTC
