|
export class AppComponent {
public data: Object[] = [
{ x: 16, y: 20 }, { x: 17, y: 30 },
{ x: 18, y: 70 }, { x: 19, y: 80 },
{ x: 20, y: 100 }
];
//Initializing Primary X Axis
public primaryXAxis: Object = {
title: 'Death Overs',
minimum: 15,
maximum: 21,
interval: 1,
majorGridLines: { width: 0 }
};
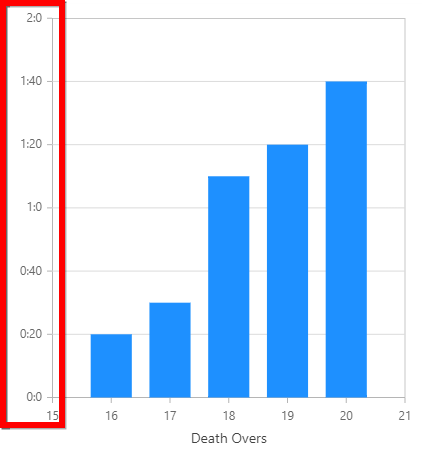
public primaryYAxis: Object = {
interval: 20
};
public labelRender(args: IAxisLabelRenderEventArgs): void {
if (args.axis.name === "primaryYAxis") {
let hours: number = 0;
let minutes: number = 0;
hours = parseInt((args.value/60).toFixed(1));
minutes = args.value % 60;
args.text = hours + ':' + minutes;
}
};
constructor() {
//code
};
} |
|
<div class="control-section">
<div align='center'>
<ejs-chart style='display:block;' [width]='width' align='center' id='chartcontainer'
[primaryXAxis]='primaryXAxis' [primaryYAxis]='primaryYAxis' (axisLabelRender)='labelRender($event)'>
<e-series-collection>
<e-series [dataSource]='data' type='Column' xName='x' yName='y' fill = '#1e90ff' width=2> </e-series>
</e-series-collection>
</ejs-chart>
</div>
</div> |