- Home
- Forum
- Xamarin.Forms
- Size of Radar Chart
Size of Radar Chart
I'm having issues getting a radar char to display nicely for me, it seems very small no matter what I try. The only thing I've found that works is to scale up the entire chart which then causes issues as the chart then over laps the content its embedded in.
Attachment: SandBox_d30bca97.zip
I've attached the bare bones of a little sandbox solution with my xaml markup and backing data in the viewmodel. Could you let me know what I'm doing wrong with the markup to create such a small chart?
Attachment: SandBox_d30bca97.zip
SIGN IN To post a reply.
2 Replies
SI
Simon
October 10, 2019 07:59 AM UTC
Just to add to this, the issue seems to be when you reach content length that means the content is scrollable
My xaml has a dynamic stacklayout that I add labels to depending on the chart data, I've simulated it by amending the sandbox xaml like this;
<?xml version="1.0" encoding="utf-8" ?>
<ContentPage xmlns="http://xamarin.com/schemas/2014/forms"
xmlns:x="http://schemas.microsoft.com/winfx/2009/xaml"
xmlns:chart="clr-namespace:Syncfusion.SfChart.XForms;assembly=Syncfusion.SfChart.XForms"
x:Class="SandBox.Views.MainPage">
<NavigationPage.TitleView>
<Label Text="{Binding Title}" FontSize="16" TextColor="White" />
</NavigationPage.TitleView>
<ScrollView BackgroundColor="DarkGray">
<StackLayout>
<StackLayout Orientation="Horizontal" HorizontalOptions="CenterAndExpand" Margin="0,0,0,18">
<Label Text="DATE" FontSize="18" Margin="0"/>
<Frame CornerRadius="5" IsClippedToBounds="true" BackgroundColor="White" Margin="0,1,0,0" Padding="8,0">
<Label Text="01/01/2021" HorizontalTextAlignment="Center" FontSize="16" FontAttributes="Bold" />
</Frame>
</StackLayout>
<chart:SfChart BackgroundColor="White" ChartPadding="0" HeightRequest="320">
<chart:SfChart.Scale>
<OnPlatform x:TypeArguments="x:Double" iOS="1" Android="1" />
</chart:SfChart.Scale>
<chart:SfChart.Margin>
<OnPlatform x:TypeArguments="Thickness" iOS="0" Android="0" />
</chart:SfChart.Margin>
<chart:SfChart.PrimaryAxis>
<chart:CategoryAxis>
<chart:CategoryAxis.MajorTickStyle>
<chart:ChartAxisTickStyle StrokeColor="Transparent" />
</chart:CategoryAxis.MajorTickStyle>
<chart:CategoryAxis.MajorGridLineStyle>
<chart:ChartLineStyle StrokeColor="Black" StrokeWidth="1" />
</chart:CategoryAxis.MajorGridLineStyle>
<chart:CategoryAxis.AxisLineStyle>
<chart:ChartLineStyle StrokeColor="Black" StrokeWidth="1" />
</chart:CategoryAxis.AxisLineStyle>
<chart:CategoryAxis.LabelStyle>
<chart:ChartAxisLabelStyle TextColor="Black" />
</chart:CategoryAxis.LabelStyle>
</chart:CategoryAxis>
</chart:SfChart.PrimaryAxis>
<chart:SfChart.SecondaryAxis>
<chart:NumericalAxis Maximum="5" Minimum="0" Interval="1" >
<chart:NumericalAxis.MajorTickStyle>
<chart:ChartAxisTickStyle StrokeColor="Transparent"/>
</chart:NumericalAxis.MajorTickStyle>
<chart:NumericalAxis.LabelStyle>
<chart:ChartAxisLabelStyle TextColor="Black" FontSize="7"/>
</chart:NumericalAxis.LabelStyle>
<chart:NumericalAxis.AxisLineStyle>
<chart:ChartLineStyle StrokeColor="Black" StrokeWidth="1" />
</chart:NumericalAxis.AxisLineStyle>
<chart:NumericalAxis.MajorGridLineStyle>
<chart:ChartLineStyle StrokeColor="Black" StrokeWidth="1" />
</chart:NumericalAxis.MajorGridLineStyle>
</chart:NumericalAxis>
</chart:SfChart.SecondaryAxis>
<chart:SfChart.Series>
<chart:RadarSeries ItemsSource="{Binding RadarData}" EnableTooltip="True" EnableAnimation="True" XBindingPath="Name" YBindingPath="Value" Opacity="0.8" DrawType="Area" Color="Aqua" />
</chart:SfChart.Series>
</chart:SfChart>
<StackLayout>
<Label Text="Lots more content here..." />
<Label Text="Lots more content here..." />
<Label Text="Lots more content here..." />
<Label Text="Lots more content here..." />
<Label Text="Lots more content here..." />
<Label Text="Lots more content here..." />
<Label Text="Lots more content here..." />
<Label Text="Lots more content here..." />
<Label Text="Lots more content here..." />
<Label Text="Lots more content here..." />
<Label Text="Lots more content here..." />
<Label Text="Lots more content here..." />
<Label Text="Lots more content here..." />
<Label Text="Lots more content here..." />
<Label Text="Lots more content here..." />
<Label Text="Lots more content here..." />
<Label Text="Lots more content here..." />
<Label Text="Lots more content here..." />
<Label Text="Lots more content here..." />
<Label Text="Lots more content here..." />
<Label Text="Lots more content here..." />
<Label Text="Lots more content here..." />
</StackLayout>
</StackLayout>
</ScrollView>
</ContentPage>
HM
Hemalatha Marikumar
Syncfusion Team
October 10, 2019 01:58 PM UTC
Hi Simon,
Greetings from Syncfusion.
We have validated your code snippet and we would like to let you know that you are setting the Padding value as 30 to StackLayout and setting VerticalOptions as Center for SfChart in your sample. It will reduce the chart height and width.
Greetings from Syncfusion.
We have validated your code snippet and we would like to let you know that you are setting the Padding value as 30 to StackLayout and setting VerticalOptions as Center for SfChart in your sample. It will reduce the chart height and width.
You can resolve this issue by reducing the StackLayout Padding value and setting VerticalOptions and HorizontalOptions as CenterAndExpand for SfChart as per the below code snippet.
Code Snippet[Xaml]:
|
<ScrollView BackgroundColor="DarkGray">
<StackLayout>
<StackLayout.Padding>
<OnPlatform x:TypeArguments="Thickness" iOS="5" Android="5" />
</StackLayout.Padding>
…………
<StackLayout>
<chart:SfChart x:Name="Chart" VerticalOptions="CenterAndExpand" HorizontalOptions="CenterAndExpand" BackgroundColor="White" ChartPadding="0" >
……….
</chart:SfChart>
</StackLayout>
</StackLayout>
</ScrollView>
|
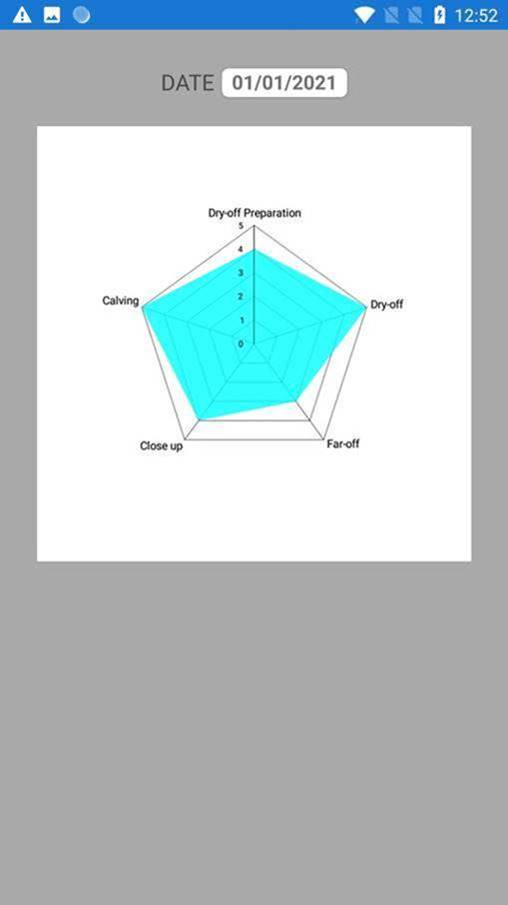
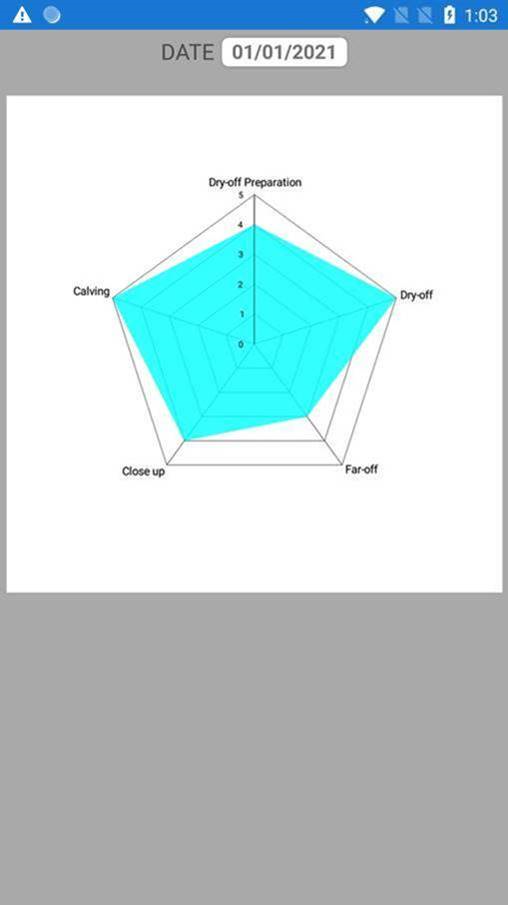
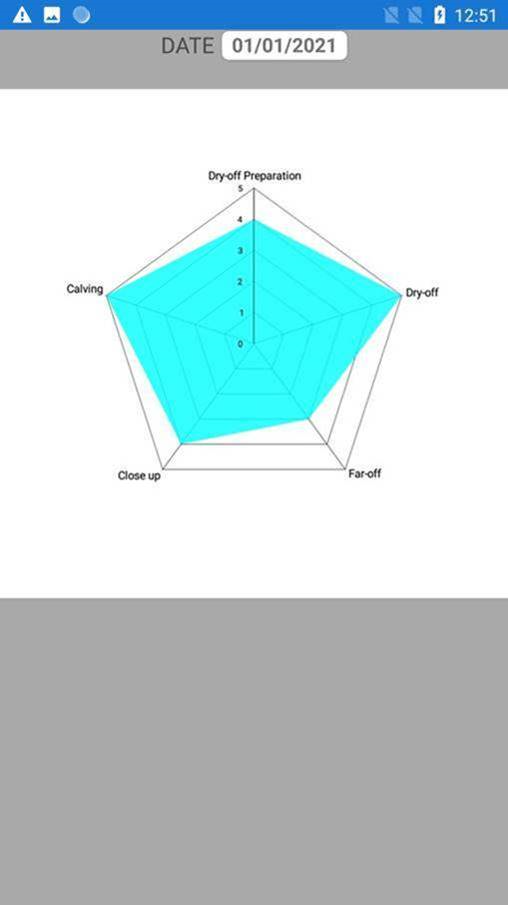
Screenshot:
|
StackLayout Padding value is 30 |
StackLayout Padding value is 5 |
StackLayout Padding value is 0 |
 |
 |
 |
And we have prepared a sample based on your requirement and you can download the sample from the below link.
Sample Link : https://www.syncfusion.com/downloads/support/directtrac/148186/ze/1481862093829550.zip
Note: Polar/Radar series will be drawn by forming the square shape rect based on the minimum width or height.
Note: Polar/Radar series will be drawn by forming the square shape rect based on the minimum width or height.
Regards,
Hemalatha M.
SIGN IN To post a reply.
- 2 Replies
- 2 Participants
-
SI Simon
- Oct 9, 2019 12:05 PM UTC
- Oct 10, 2019 01:58 PM UTC
