- Home
- Forum
- ASP.NET Core - EJ 2
- How to Create a Chart Dynamically from an MVC Controller or Razor
How to Create a Chart Dynamically from an MVC Controller or Razor
I'm using ASP.Net Core MVC. I have a page where I am calling a REST service and then deserializing the complex JSON response into an object (it's too complex to do with just a list, it's an object with collections of objects which have to be looped through). I then need to parse the data and create a Stacking Column Chart. The number of items in the stacked columns varies and the colors and tooltips are defined in the data along with a lot of other logic that needs to run as I loop through the data. I also need to be able to page through the data. So I want to dynamically create the chart by looping through the object created from the JSON response. How can I do this from the controller or using Razor on the view page? I want whatever will give me the maximum flexibility in creating the chart.
SIGN IN To post a reply.
8 Replies
KC
Kalaimathi Chellaiah
Syncfusion Team
September 23, 2019 11:44 AM UTC
Hi Scott,
Greetings from Syncfusion.
We are preparing a sample based on your scenario and we will update the status on or before 6.30PM IST(September 23, 2019). We appreciate your patience until then.
Regards,
Kalai.
KC
Kalaimathi Chellaiah
Syncfusion Team
September 23, 2019 05:46 PM UTC
Hi Scott,
Thanks for being patience.
We have analysed your query. We have prepared a sample based on your scenario using Ajax and setInterval method. Please find below code snippet and sample,
Code Snippet:
|
[Index.cshtml]:
<div class="row" style="margin-top:10px">
<div class="col-md-8">
<ejs-chart id="container" title="Sales History of Product X">
<e-series-collection>
<e-series dataSource="ViewBag.dataSource1" xName="xvalue" yName="yValue1" fill="blue" visible="true" type="StackingColumn">
<e-series-animation enable="false"></e-series-animation>
</e-series>
<e-series dataSource="ViewBag.dataSource1" xName="xvalue" yName="yValue2" fill="red" visible="true" type="StackingColumn">
<e-series-animation enable="false"></e-series-animation>
</e-series>
</e-series-collection>
<e-chart-tooltipsettings enable="true"></e-chart-tooltipsettings>
<e-chart-legendsettings visible="true"></e-chart-legendsettings>
</ejs-chart>
</div>
</div>
<script>
setInterval(refreshChart, 3000);
function refreshChart() {
var chart = document.getElementById("container").ej2_instances[0];
var i = 10;
var obj = { value: i };
$.ajax({
type: "POST",
url: "/Home/GetChartData",
data: obj,
success: function (data) {
chart.series[0].dataSource = data;
chart.series[0].xName = "x";
chart.series[0].yName = "y";
chart.series[0].fill = "green";
chart.series[1].dataSource = data;
chart.series[1].xName = "x";
chart.series[1].yName = "y1";
chart.series[1].fill = "orange";
chart.refresh();
},
error: function (args) {
alert('error');
}
});
}
</script>
[HomeController.cs]:
[HttpPost]
public JsonResult GetChartData(string value)
{
Random r = new Random();
List<ExportChartData> data2 = new List<ExportChartData>();
for (int i = 0; i < Int32.Parse(value); i++)
data2.Add(new ExportChartData(i, r.Next(10, 100), r.Next(50, 100)));
ViewBag.dataSource = data2;
return Json(data2);
} |
Sample: https://www.syncfusion.com/downloads/support/directtrac/general/ze/Dynamic_Chart830805717.zip
Kindly revert us, if this is not your exact requirement.
Regards,
Kalai.
SH
Scott Hancock
September 23, 2019 07:57 PM UTC
As I mentioned I need full control over creating the chart. I won't know how many columns and stacked charts there will be until I look at the data and what filters the user has chosen. So I need to loop through the data and create series as I go.
Also, is Javascript the only choice. Can this be done in Razor. Where can I find the Javascript and Razor api for Asp.Net Core?
Thanks
KC
Kalaimathi Chellaiah
Syncfusion Team
September 24, 2019 01:26 PM UTC
Hi Scott,
Thanks for the update.
We have analyzed your query. From that, we suggest you to use below methods.
Method #1:
We can get the data length from controller to view. Based on that we can render the series using loop. We have attached code snippet for your reference.
Code Snippet:
|
[Index.cshtml]:
@{
var count = Enumerable.Count(ViewBag.Items);
}
<ejs-chart id="container" title="Sales History of Product X">
<e-series-collection>
@for (var i = 0; i < count; i++)
{
<e-series dataSource="ViewBag.Items[i]" xName="xValue" yName="yValue1" visible="true" type="StackingColumn">
<e-series-animation enable="false"></e-series-animation>
</e-series>
}
</e-series-collection>
<e-chart-tooltipsettings enable="true"></e-chart-tooltipsettings>
<e-chart-legendsettings visible="true"></e-chart-legendsettings>
</ejs-chart>
[HomeController.cs]:
public IActionResult Index()
{
List<List<DoubleAxisData>> data = new List<List<DoubleAxisData>>();
List<DoubleAxisData> chartData = new List<DoubleAxisData>
{
new DoubleAxisData { xValue = 16, yValue1 = 12, yValue2= 7},
new DoubleAxisData { xValue = 17, yValue1 = 14, yValue2 = 7 },
};
List<DoubleAxisData> chartData1 = new List<DoubleAxisData>
{
new DoubleAxisData { xValue = 16, yValue1 = 2, yValue2= 7},
new DoubleAxisData { xValue = 17, yValue1 = 14, yValue2 = 7 },
};
data.Add(chartData);
data.Add(chartData1);
ViewBag.Items = data;
return View();
}
public class DoubleAxisData
{
public double xValue;
public double yValue1;
public double yValue2;
} |
Screenshot:
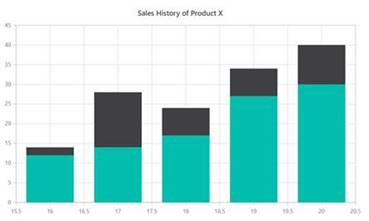
Method #2:
We can achieve your requirement using dictionary object also. We have created sample based on your requirement. In that we have created three data list in model, then add this list values into the dictionary object. Now dictionary object contains three set of datasource values, then add series dynamically based on dictionary objects(data collection) length. Please find below code snippet,
Code snippet:
[Index.cshtml]:
|
@{
ViewData["Title"] = "Home Page";
var carriers = new Dictionary<string, List<Dynamic_Chart.Models.Data>>();
carriers.Add("Series 1", Dynamic_Chart.Models.Data.GetAllData());
carriers.Add("Series 2", Dynamic_Chart.Models.Data.GetAllData1());
carriers.Add("Series 3", Dynamic_Chart.Models.Data.GetAllData2());
}
<ejs-chart id="container" title="Sales History of Product X">
<e-series-collection>
@foreach (KeyValuePair<string, List<Dynamic_Chart.Models.Data>> carrier in carriers)
{
xName="Month"
yName="Price"
dataSource="carrier.Value"
type="@Syncfusion.EJ2.Charts.ChartSeriesType.StackingColumn" fill="@carrier.Value[carriers.Count].fill">
</e-series>
}
</e-series-collection>
<e-chart-tooltipsettings enable="true"></e-chart-tooltipsettings>
<e-chart-legendsettings visible="true"></e-chart-legendsettings>
</ejs-chart> |
Data.cs[models]:
|
public class Data
{
public static List<Data> data = new List<Data>();
//some code here
} |
Screenshot:
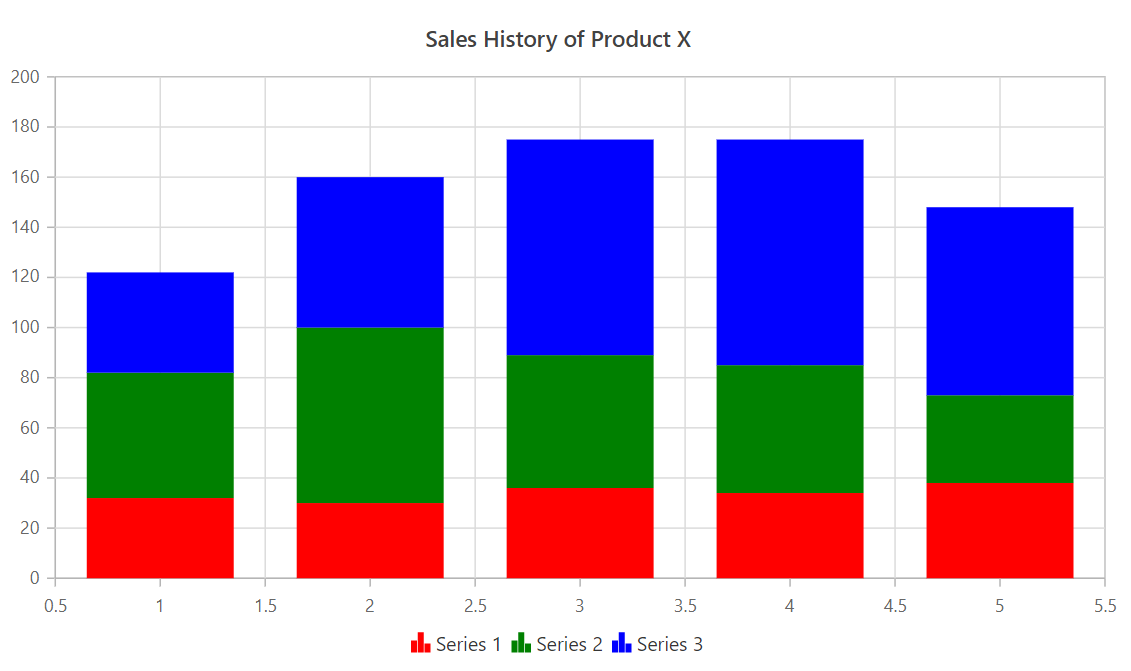
Sample: https://www.syncfusion.com/downloads/support/directtrac/general/ze/Dynamic_Series142179170.zip
Also here we have attached Core, JS and MVC UG links for your reference,
Kindly revert us, if still this is not your exact requirement.
Regards,
Kalai.
SH
Scott Hancock
September 26, 2019 12:55 AM UTC
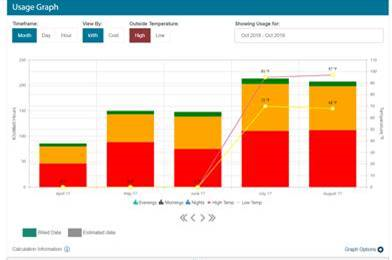
I'm trying the first method but I'm having some difficulty. It seems to be working but it's not drawing a graph. I've attached my project. I've created a view called Graph, a controller called GraphController and a model called GraphModel. I'm reading in some sample json data from a file called shortcomplexresults.json to simulate a call to a service. The model was generated from the JSON. The x axis is Months and the y axis is power usage. Each column is the power usage for the month. Each stacked column is made of three parts: mornings, evenings and nights (for the power usage during the 3 parts of the day). The json data looks like this:
Attachment: TXUMED_b50adf42.zip
"Result": {
"TotalPages": 0,
"TotalRecords": 24,
"Page": 0,
"PageSize": 72,
"Records": [
{
"DisplayedPeriod": "2017-04-01T00:00:00",
"PeriodStart": "2017-03-30T00:00:00",
"PeriodEnd": "2017-04-17T00:00:00",
"IsEstimated": false,
"DayCount": 18,
"TotalUsage": 598.0,
"Cost": 85.78,
"Category": "ZENRGY",
"ProductType": "FREED_PLAN",
"LineItems": [
{
"ActualPortion": 46.32,
"Percentage": 0.0,
"Category": {
"Color": "Purple",
"Label": "Evenings",
"TooltipLabel": "For hours breakdown for your product see the Electricity Facts Label document located on your My Plans & Products page, or refer to the Hourly view of your Usage Graph",
"Index": 12
},
"InnerCategory": {
"Color": "Purple",
"Label": "Evenings",
"TooltipLabel": "For hours breakdown for your product see the Electricity Facts Label document located on your My Plans & Products page, or refer to the Hourly view of your Usage Graph",
"Index": 12
}
},
I get the month from the DisplayPeriod and the LineItems are the stacked column data (morning, evening and nighttime). I believe the issue is how I'm binding the y axis to the ListItems object but I can't figure our the correct syntax. Can you tell me what I'm doing wrong here?
Thanks,
Scott
Attachment: TXUMED_b50adf42.zip
KC
Kalaimathi Chellaiah
Syncfusion Team
September 26, 2019 06:41 PM UTC
Hi Scott,
Thanks for your update.
We are checking your query with attached sample and we will update the status within one business day(September 27th ,2019). We appreciate your patience until then.
Regards,
Kalai.
KC
Kalaimathi Chellaiah
Syncfusion Team
September 29, 2019 06:12 PM UTC
Hi Scott,
Thanks for being patience
Still, we are analysing your query with attached sample how to bind the complex data to the series and we will update the status within one business day(September 30 ,2019). We appreciate your patience until then.
Regards,
Kalai.
KC
Kalaimathi Chellaiah
Syncfusion Team
October 1, 2019 07:15 AM UTC
Hi Scott,
Sorry for the inconvenience caused.
We have analyzed your query. From that, we would like to let you know that we cannot bind the dataSource structure as per your sample. So we suggest to convert the complex structure into json format and bind it to the chart series.. We have prepared a workaround solution with your sample. In that stackingColumn is working properly as per provided data. Please find below sample,
Code Snippet:
|
@{
var count = Enumerable.Count(ViewBag.dataSource1);
}
@for (int x = 0; x < count; x++)
{
string theYName = ("y" + x).ToString();
<e-series dataSource="ViewBag.dataSource1[x]" name="@Model.Result.Records[0].LineItems[x].Category.Label"
selectionStyle="series"
xName="month"
width="2"
opacity="1"
yName="@theYName"
yAxisName="powerAxis"
type="@Syncfusion.EJ2.Charts.ChartSeriesType.StackingColumn"
pointColorMapping="color">
<e-series-animation enable="false"></e-series-animation>
</e-series>
} |
Screenshot:
Sample: https://www.syncfusion.com/downloads/support/directtrac/general/ze/stackin_dynamic-1449350834.zip
Kindly check the above sample and revert us, if still you have faced any problems.
Regards,
Kalai.
SIGN IN To post a reply.
- 8 Replies
- 2 Participants
-
SH Scott Hancock
- Sep 22, 2019 07:05 PM UTC
- Oct 1, 2019 07:15 AM UTC
