- Home
- Forum
- ASP.NET MVC
- DOCIO Bar Stacked Chart 508 Compliance.
DOCIO Bar Stacked Chart 508 Compliance.
Hi,
We need to make Bar Stacked Chart generated by DOCIO class 508 Compliant. Couple of issues we need to fix are :
The segment on the bars need some visual distinction other than color. While, the alt text is used by people with no vision, a color blind person may not use it. If they can’t tell the difference between e.g . blue and orange, they can’t read the graph. A pattern on one segment or each segment labeled (no the value of the segment, they can read the axis) can provide the other visual distinction.
2. How do we generate a table below the stacked bar chart with all the data points using Syncfusion Stack Chart Properties..
Please see attachment. The attachment contains a Stack Bar Chart generated using Synfusion DOCIO.. The table below has been generated using Word. Need to generate it using Synfusion Stack Chart Properties.
Thanks
Attachment: 508__Stack_Chart_5acb5980.zip
SIGN IN To post a reply.
5 Replies
PR
Poorani Rajendran
Syncfusion Team
September 12, 2019 06:55 PM UTC
Hi Robin,
Thank you for contacting Syncfusion support.
Regarding bars need some visual distinction other than color:
To meet your requirement, we suggest you use Patterned API to set fill pattern for different series and use AddTable API to add table in the Word document. We have prepared the sample application and it can be downloaded from the below link:
https://www.syncfusion.com/downloads/support/forum/147440/ze/CreateWordSample-2094826532
In the sample, we have done following things,
1. Creates a new Word document.
2. Adds section and paragraph to the document.
3. Adds chart using AppendChart API and adds its data.
4. Sets the different fill pattern for the chart using Patterned API.
5. Adds table in the Word document using AddTable API
6.Sets the required width for the cell using TableCell.Width API.
7.Saves and close the Word document.
Please let us know if you have any other questions.
Regards,
Poorani Rajendran
RK
Robin Knight
September 15, 2019 05:41 PM UTC
Thank you for the information.. In Microsoft word, if we have the options to add Datatable, Datalabels on the chart.
The Datatable adds the table below the chart. In Synfusion, do you have the API to add Datatable below the chart or we use AddTable API.
Please see attachment.
Attachment: StackBar_Chart_468a9592.zip
PR
Poorani Rajendran
Syncfusion Team
September 16, 2019 12:51 PM UTC
Thank you for your update.
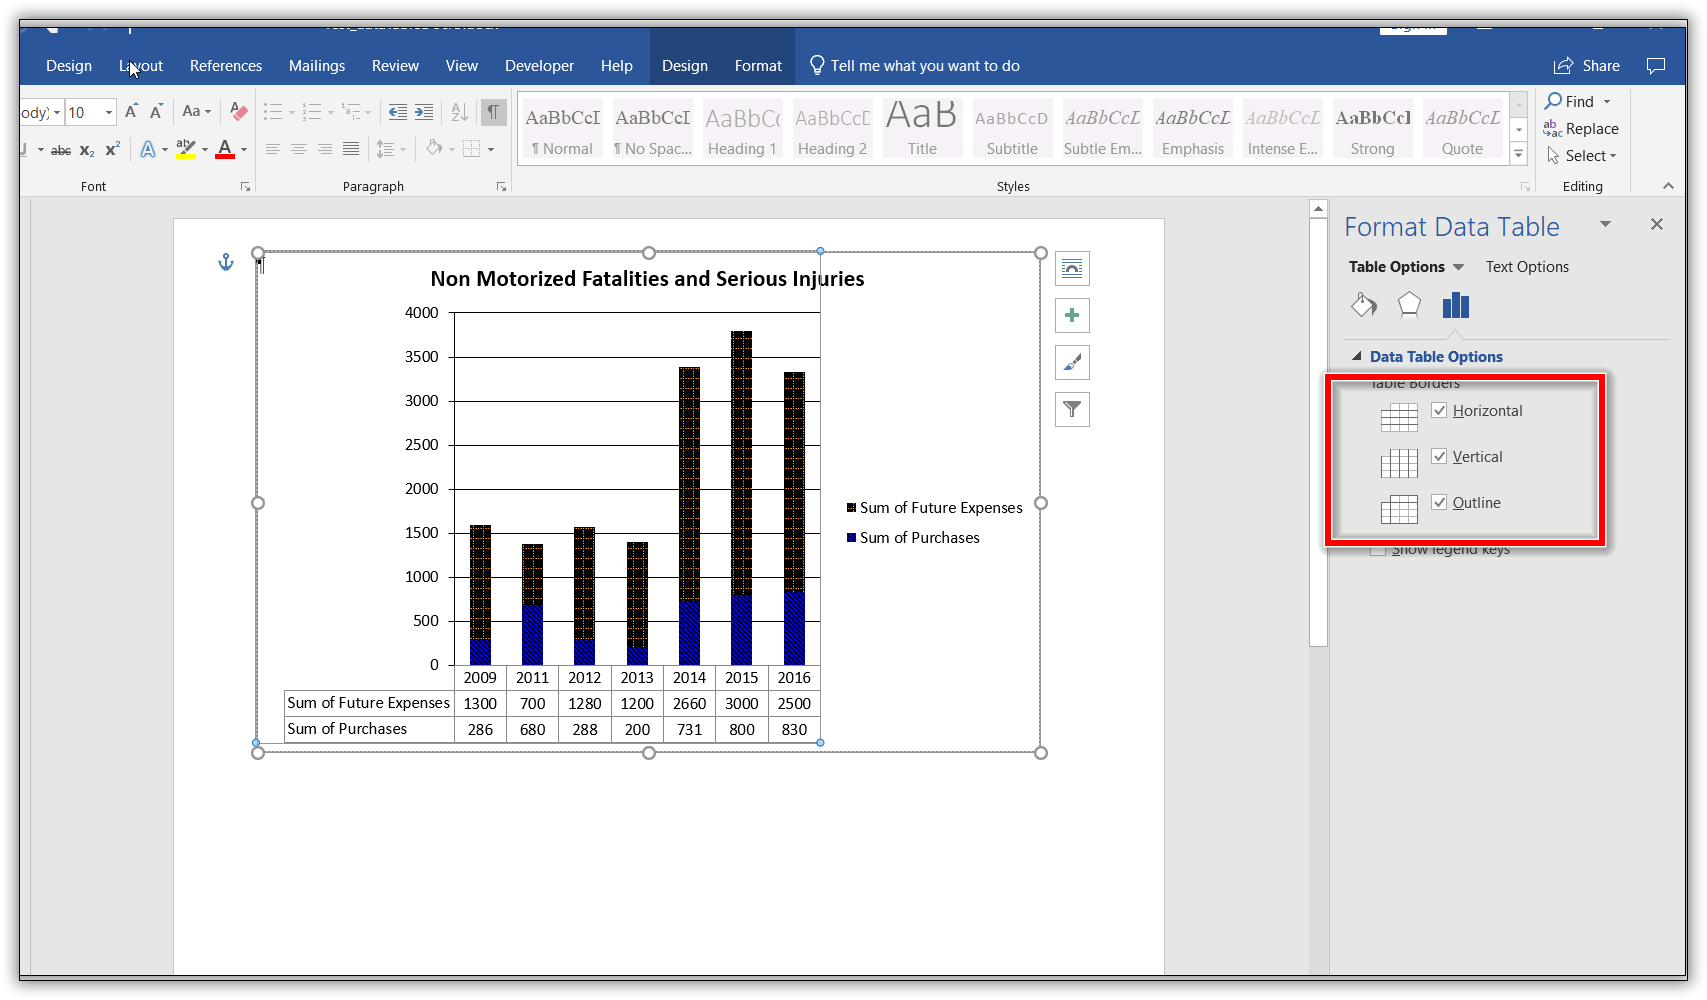
To meet your requirement, we suggest you to use enable HasDataTable API to add the table in the chart. But you cannot add the cell in the left of “2009”, because in Microsoft Word application doesn’t have any cells in front of series values.
Please refer the screen shot:
We have prepared the sample application for adding DataTable in the chart and it can be downloaded from the below link:
https://www.syncfusion.com/downloads/support/forum/147440/ze/CreateWordSample375796702
Please let us know if you have any other questions.
Regards,
Poorani Rajendran.
RK
Robin Knight
November 19, 2019 01:27 AM UTC
Does the patterned API support Stack Bar chart with light blue color. Please see zip file
Thanks
Attachment: Stack_Bar_Chart_cf4c6f01.zip
SR
Suganya Rathinam
Syncfusion Team
November 19, 2019 11:59 AM UTC
Hi Robin,
We can specify the pattern and color for the series of the stacked bar chart using the following code snippets.
We can specify the pattern and color for the series of the stacked bar chart using the following code snippets.
|
chart.Series[1].SerieFormat.Fill.ForeColor = Color.LightBlue;
chart.Series[1].SerieFormat.Fill.BackColor = Color.White;
chart.Series[1].SerieFormat.Fill.Patterned(OfficeGradientPattern.Pat_Light_Downward_Diagonal); |
For complete sample refer here.
Please find the list of supported pattern types from the following link.
https://help.syncfusion.com/cr/file-formats/Syncfusion.OfficeChart.OfficeGradientPattern.html
Regards,
Suganya R
SIGN IN To post a reply.
- 5 Replies
- 3 Participants
-
RK Robin Knight
- Sep 11, 2019 12:13 AM UTC
- Nov 19, 2019 11:59 AM UTC
