We use cookies to give you the best experience on our website. If you continue to browse, then you agree to our privacy policy and cookie policy. Image for the cookie policy date
close icon

Update Chart Based On Grid Update

Our grid displays data for a session. We need to update the 'Count' on the top grid but want to signify on the bottom graph that the numbers have been altered. Our approach is to make the grid lines dashed after editing.


Here's the desired result after update.


Is there a way to access the Chart and change the line style when the Update button has been clicked?
Thanks

1 Reply

KC Kalaimathi Chellaiah Syncfusion Team August 15, 2019 11:54 AM UTC

Hi Mark, 
 
Greetings from Syncfusion. 
 
We have analyzed your query. We can achieve your requirement using actionComplete event of the grid. By using grid dataBound method, you can create the chart based on grid data. Then using actionComplete method you can change the rendered chart styles based on the request type. We have prepared a simple sample for your reference. Please find below, 
 
Code Snippet: 
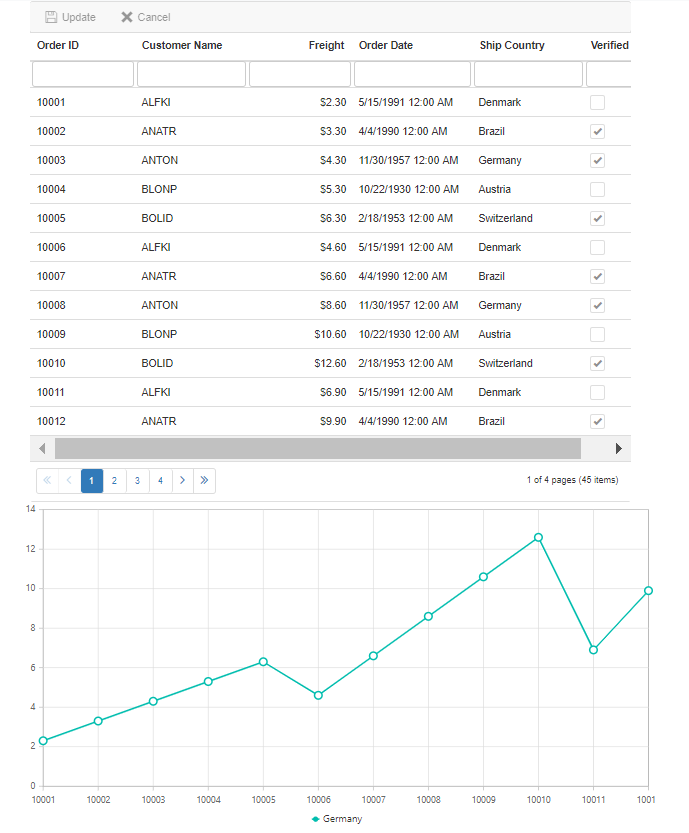
   <ejs-grid id="Grid" dataSource="ViewBag.dataSource" dataBound="dataBound"  
    toolbar="@(new List<string>() { "Update", "Cancel" })" allowPaging="true"  
     allowFiltering="true" actionComplete="actionComplete"> 
    </ejs-grid> 
<div id="Chart"></div> 
<script> 
    var chart; 
    function dataBound(args) { 
        var grid = document.getElementById("Grid").ej2_instances[0]; 
        chart = new ej.charts.Chart({ 
            //Initializing Primary X Axis 
            primaryXAxis: { 
                
            }, 
            series: [ 
                { 
                    type: 'Line', 
                    dataSource: grid.getCurrentViewRecords(), 
                    xName: 'OrderID', width: 2, marker: { 
                        visible: true, 
                        width: 10, 
                        height: 10 
                    }, 
                    yName: 'Freight', name: 'Germany', 
                }, 
            ], 
 
        }); 
        chart.appendTo('#Chart'); 
    } 
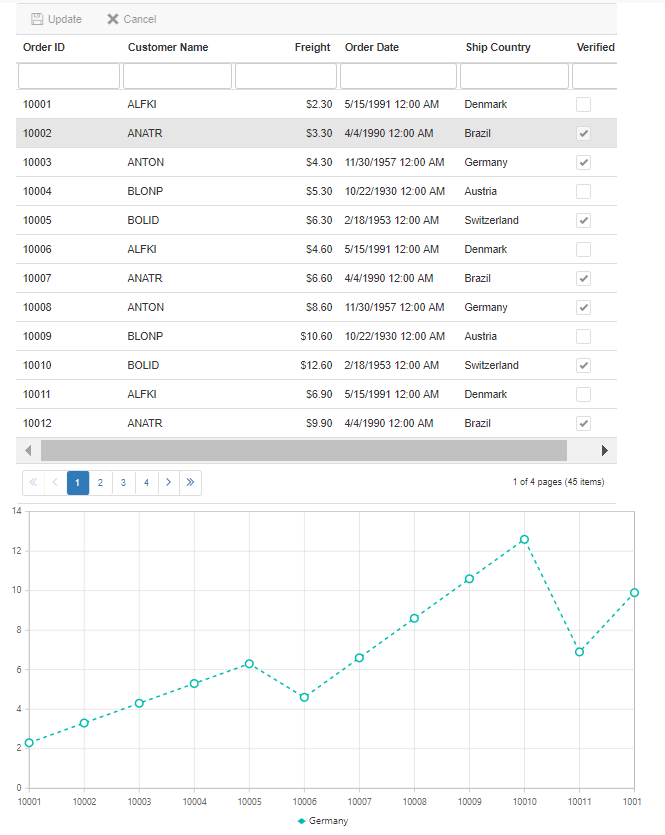
    function actionComplete(args) { 
        if (args.requestType === 'save') { 
            chart.series[0].dashArray = '5,5'; 
            chart.refresh(); 
        } 
    } 
</script> 
 
Screenshot: 
Initial Rendering 
After Update Button Clicked 


Kindly revert us, if you have any queries. 
 
Regards, 
Kalai. 


Loader.
Live Chat Icon For mobile
Up arrow icon